Executive Summary
At the start of the human tragedy that is the Ukraine war, I delved into the underlying causes of the conflict from the perspective of a historian and political scientist. That analysis, “Understanding The Great Game in Ukraine,” is available here.
Events have progressed since then, and an important fallout of the war has been economic. In this article, I look at the role and situation of Europe from the perspective of an economist.
The European Union has taken a very definite political stance on the Russia-Ukraine conflict, aligned with the United States. It has applied 8 rounds of economic sanctions against Russia, and at the time of writing, is working on a 9th package.
What has the economic impact of these sanctions been - on Russia and on Europe itself? What will happen in the months to come? That is the focus of the present article. I conclude that
- The war in Ukraine that started on February 24, 2022, is going to be the most consequential change in the world since the Second World War. It is going to fundamentally change power relationships in the world. The dominance of the Western world will end and be replaced by a multipolar world.
- Europe’s prosperity of the past few centuries is likely to end because of short-sighted and poorly-thought-out decisions related to the Ukraine conflict, taken by European leaders with the full support of their people. These have to do primarily with the ill-considered economic sanctions that Europe has unilaterally applied on Russia, that have started to boomerang on Europe, with the high probability of things getting much worse in the coming months.
The analysis presented here is primarily an economic one, and mainly looks at the effect on the economies of Europe of prolonged sanctions (and, in the present context, “prolonged” could even mean another six months) imposed by the West on Russia.
I present evidence that makes the case that Western sanctions on Russia have hurt Europe a lot more than they have hurt Russia in the nine months since they were imposed, and in the coming months will continue to severely degrade Europe’s economies, while only marginally affecting Russia’s. The primary reason for this is that Russia is far more self-sufficient than Europe is. The only action that will save Europe is an unconditional revocation of its self-destructive sanctions and a peace agreement in Ukraine on Russia's terms.
The only major assumptions I have made in this analysis are that, in the next two to three months,
- The war in Ukraine does not end in complete defeat for Russia
- Ukraine and Russia do not reach a peace agreement, and
- Vladimir Putin is not ousted in a coup in Russia — and hence, the current economic and military policies of both Europe and Russia will continue for the foreseeable future.
Although Russia looks unlikely to be affected very significantly by Western sanctions, and is in a strong position on the battlefield, because of its high inherent economic and military strength (recent reported gains by Ukraine notwithstanding), I argue that in the unlikely case event that Russia were to appear likely to lose the war on the battlefield or on the economic front, China will do whatever it takes to prevent such outcomes, to secure its own future.
This essay is organized in six chapters, followed by a summary and conclusions chapter:
- Chapter I details the background of the events that have happened since February 24, 2022, until today, especially the West’s economic sanctions as a response to Russia’s invasion, and highlights the fact that these sanctions, as well as the West’s military and economic aid to Ukraine, have not had the effect on Russia that the West had hoped for.
- Chapter II discusses various indicators related to the Russian economy and concludes that it is in better health than many Western nations, especially in the context of the protracted economic war between Russia and Europe that has been initiated by Europe through the enforcement of Western sanctions on Russia.
- Chapter III talks about Russia’s interconnectedness with the rest of the world and, especially, with Europe, in terms of trade balances, and concludes that Russia is far more important to Europe than Europe is to Russia. It also concludes that an embargo of Russian goods would not fatally harm the Russian economy.
- Chapter IV talks specifically about Europe’s energy dependency on Russia, and shows that Europe’s energy crisis is not one of price but of supply — that the energy supplied by Russia cannot be replaced by any other source; that most European nations are critically dependent on irreplaceable Russian supplies of natural gas, crude and refined petroleum, and coal; that a European energy embargo on Russia will be devastating to European economies and cause the de-industrialization of Europe, while causing minimal and manageable losses to Russia.
- Chapter V talks about the de-industrialization of Europe which has started to happen because of the West’s sanctions on Russia that have resulted in depriving Europe’s economies, not only of Russian gas, oil, and coal, but potentially of food, fertilizer, and several valuable minerals that Russia is a dominant supplier of, and how this de-industrialization is going to intensify in the coming months and years. It also explains how this crisis is two years in the making, and that the war in Ukraine is just the last nail in Europe’s economic coffin. It also talks about the negative consequences on Europe of the impending oil price cap that it plans to impose on Russian oil exports.
- Chapter VI talks about what Europe can do in response to these challenges, by discussing the most commonly floated solutions: gas storage in Europe, LNG (Liquefied Natural Gas), and renewable energy; and shows how none of these options will be adequate to stave off the coming economic apocalypse for Europe.
- Finally, a SUMMARY AND CONCLUSIONS chapter talks about the longer-term impact of the West’s sanctions on Russia, and how they will fundamentally change the power calculus in the twenty-first century.
Table of Contents
CHAPTER I: BACKGROUND AND CURRENT STATUS
The Failure of the Economic Blitzkrieg
The Stoppage of Russian Gas and the Nord Stream Sabotage
Who Will Win the Military and Economic Wars?
Those Who Forget History...
A Tale of Ineffective Sanctions
Key Takeaways from Chapter I
CHAPTER II: THE STRENGTH OF THE RUSSIAN ECONOMY
Sanctions are Not New to Russia
Russia’s Economic Parameters: GDP
Russia’s Economic Parameters: Debt-to-GDP Ratio
Russia’s Holdings of US Treasury Bonds
Russia’s Strength in Armaments Production
Key Takeaways from Chapter II
CHAPTER III: RUSSIA’S INTERCONNECTEDNESS WITH THE WORLD
Trade Imbalances and Export/Import Ratios
The Green Transition and the Role of Gas
Destinations of Russian Exports and Origins of Russian Imports
The China-Russia “No Limits” Partnership
A Detailed Look at Some Bilateral Relations
Russia’s Trade Balances with European Nations
Replacing Europe’s Exports to Russia
Key Takeaways from Chapter III
CHAPTER IV. EUROPE’S ENERGY DEPENDENCE ON RUSSIA
Russian Fossil Fuels Do Not Cost Europe Much
Europe’s Energy Needs and Sources
The Global Gas Market and Europe’s Needs
The Global Oil Market and Europe’s Needs
The Global Coal Market and Europe’s Needs
Individual Country Profiles
Germany
Poland
The United Kingdom
Italy
France
Summary of Europe’s Energy Dependencies on Russia
Key Takeaways from Chapter IV
CHAPTER V. THE DE-INDUSTRIALIZATION OF EUROPE
Industry Shutdowns
A Crisis Long Overdue
Natural Gas as a Feedstock
The Impact of the Oil Price Cap
More than Oil and Gas
The Chinese Domination of the Commodity Market
The Infeasibility of Economic Sanctions Against Both Russia and China
Key Takeaways from Chapter V
CHAPTER VI. EUROPE’S ENERGY OPTIONS
Europe’s Gas Storage Tanks
LNG to the Rescue?
Key Takeaways from Chapter VI
SUMMARY AND CONCLUSIONS
“Not One Step Backward!”
The Sanity Check that Europe Should Have Done in March
Where Do We Go From Here?
Overall Conclusions
LIST OF FIGURES
CHAPTER I: BACKGROUND AND CURRENT STATUS
The war in Ukraine is in its tenth month. Europe has reacted in unprecedented ways to Russia’s invasion of Ukraine. They have imposed several rounds of sanctions designed to choke the Russian economy and bring it to its knees, in order to force it to stop its military operations, in spite of the fact that Europe has been heavily dependent on Russian energy, Russian wheat, Russian fertilizers, and many other commodities originating from Russia.
 |
| Figure 001. The Russian Invasion of Ukraine |
The Failure of the Economic Blitzkrieg
The initial sanctions from Europe were unprecedented in their severity. The West imposed crippling economic sanctions against Russia, including banning most Russian banks from the SWIFT payment mechanism, which meant that Russia could no longer do business in US dollars. The US seized about half of Russia’s dollar reserves, more than $300 billion worth, that had been deposited in Western banks. The West threatened to sanction any country that was buying oil from Russia. Many prominent Western businesses closed shop in Russia.
The US and Europe believed that these sanctions would be enough to deal a crushing blow to Russia’s war machine and force them to pull back from Ukraine in exchange for the sanctions to be withdrawn. But this did not happen. More than eight months since these “crippling economic sanctions” were imposed, most Russians have barely felt their impact. The lives of ordinary Russians have yet to be impacted in any meaningful way. Yes, McDonald’s has sold its operations to a Russian company, but business for the new company is still going strong. Russians love their burgers under any name.
 |
| Fig. 002. The Renamed McDonald's in Moscow |
While oil sales from Russia to the West have dropped, other countries, such as China and India, have ramped up their purchases of Russian oil. Russia has earned record revenues from oil sales ever since the war broke out, even as it gives huge discounts to countries buying its oil.
 |
| Fig. 003. Russian Oil Revenues Since the Start of the War |
On the battlefield, Russia today controls 15%-20% of Ukraine’s former territory, and has even formally added parts of territory that once belonged to Ukraine to Russia.
 |
| Fig. 004. The Four Provinces Formally Annexed by Russia |
This was not supposed to happen. Russia was not supposed to have the capacity to still wage war after eight months. The Western sanctions policy has failed – at least until now.
 |
| Fig. 005. Ganesh Prasad's Representation of Europe's Sanctions Against Russia |
Faced with the failure of their sanctions policy so far, the West (mainly, Europe, the US, Canada, Australia, Japan, and South Korea) had two choices. One, abandon sanctions, pursue negotiations with Moscow, and persuade Ukraine to accept Russian terms to end hostilities; or two, double down, both on economic sanctions and military assistance to Ukraine, in the hope that continued economic sanctions will eventually destroy the Russian economy and continued military aid will eventually swing the war decisively in Ukraine’s favor.
The Stoppage of Russian Gas and the Nord Stream Sabotage
Had the West chosen the first option, the war would have ended, gas supplies from Russia to Europe would have restarted, and possibly the already-ready Nord Stream 2 pipeline would also have started supplying even cheaper energy to Europe in addition to Nord Stream 1, powering Europe’s industry to be world leaders. Of course, this would be seen as a betrayal of Ukraine, after all the bombast involved in European leaders extending their support to the Ukrainians. It would mean a loss of face for European leaders and the ascent of Russia in Europe as the first among equals.
So the West chose the second option, in the hope that eventually, Russia would be defeated. Europe decided that they would wean themselves off Russian gas slowly, and that by December 2022 they would stop importing Russian oil. They “decided,” unilaterally (inasmuch as one can realistically decide such things in a bilateral relationship), that they would continue importing gas from Russia, albeit at reduced volumes, until such time as when they had built enough capacity through alternative means, such as renewable energy. Unfortunately for Europe, it could not control when it would stop using Russian gas. Russia claimed it was having some technical issues that forced it to stop pumping gas to Europe. This caused panic in Europe, with winter more than two months away. In recent times, the entire metallurgy industry in Europe has said that it would be closing down. Some factories have already been shut down, perhaps permanently. Rising energy prices are causing small businesses in the UK and elsewhere in Europe to shut down.
As businesses started closing down all over Europe in response to this development, and just when it seemed like things could not get any worse, an act of sabotage took place that rocked Europe. Both the Nord Stream pipelines were blown up under water and seriously damaged.
Who blew up the pipelines has still not been conclusively established. But it is clear that
- Europe would not have wanted to do so, since it was not happy with Russia’s decision to stop pumping gas. German Chancellor Olaf Scholz was so keen to have Russia start to pump gas through Nord Stream again that he took extra trouble to get the gas turbine that was being serviced in Canada back to Germany to ship to Russia.
- Russia would not be interested in blowing up its own pipeline, because it needed only to turn off the tap if it did not want to supply gas to Europe. Also, having an active pipeline gives Russia great leverage over Europe, because Russia could offer to pump gas to Europe in exchange for sanctions to be lifted. So Russia would not have blown up the pipeline.
- That leaves the US or the UK as the most likely candidates to have blown up the pipelines. The pipelines were blown up in Danish and Swedish territorial waters, and only a US or UK submarine could have entered those waters without causing a general alarm. The US also has the motive to blow up the pipeline. One, the US has been against the Nord Stream pipelines from the very start. Two, the absence of Russian gas means that Europe has no option but to buy expensive American LPG. This would mean a windfall for American oil and gas companies. America prospers, Europe suffers. Further, the UK is not terribly affected by the loss of Nord Stream gas. Continental Europe is.
Europe imports a large percentage of its energy needs. Along with gas, oil is a major import for the European continent. As in the case of gas, Russia has been a major supplier of oil to Europe. Europe has been reluctant to sanction oil because of its huge dependence, but it has been trying to impose a price cap on Russian oil, so that Russia’s revenue from oil sales can be controlled. Russia has said that it will stop supplying to anyone who agrees to the oil price cap. Although the price cap has not been finalized by the West (a unilateral move that Russia has not accepted), many European countries have been voluntarily reducing consumption of oil from Russia. Russia is selling its surplus oil to Asian countries such as China and India. But because the US, UK, and several other Western countries have stopped buying Russian crude, there is a shortage of crude oil and its derivatives, such as diesel and petrol (gasoline), in the Western world. This has had the effect of raising petrol prices in the US, the UK, and Europe. The US has tried to ameliorate the situation in America by releasing almost a million barrels of oil every day from its strategic reserve for the past few months. This has greatly reduced the storage in the American Strategic Petroleum Reserve, and cannot continue for ever. Since the beginning of the war, the level of the strategic petroleum reserve of the US has dropped by nearly a third. Recently, the US tried to influence Saudi Arabia to raise production to compensate for the lack of Russian oil. But the Saudis refused, leading to strong reactions in Washington. So the problem of an oil shortage will last for a long time. Thus, Europe will have to deal with an oil and a gas shortage.
 |
| Fig. 006. The Decline in US Strategic Petroleum Reserve Stocks |
Who Will Win the Military and Economic Wars?
At this juncture, it is unclear what the outcome of the military conflict will be. But we can be certain about a few things. The only possible outcomes are that Russia wins the war or that there is a stalemate. Russia cannot be defeated. The reasons for this conclusion are:
- Russia is a far larger economy and a country with a much bigger population.
- Russia is more prosperous than Ukraine and has a bigger industrial base.
- The US and NATO will not directly intervene on Ukraine’s side, even as they might provide military advisors and military equipment.
- China is on Russia’s side.
Let us expand a little on the above points. It was Carl von Clausewitz, the famous military strategist, who said, “War is the mere continuation of policy with other means.” That means that war cannot and should not be seen in isolation — it must be seen as an accompaniment to economics and politics. And therefore, the side that usually prevails in war is the one that is stronger economically and more stable politically.
Ukraine had a GDP of $200 billion in 2021, and Russia had a GDP of $1.78 trillion in the same year — nearly nine times the GDP of Ukraine. Ukraine had a population of 44 million in 2021; Russia had a population of 143 million in the same year. Also, on a purchasing power parity (PPP) basis, Russia has a GDP per capita that is more than twice that of Ukraine ($27,970 vs $12,944). All this means that Russia has a higher ability to replace losses in both men and materiel, and a higher ability to endure hardship. This makes it harder for Ukraine to win a war of attrition, which is what this war has now become.
Politically, too, Russia is far more stable than Ukraine. Ukraine is essentially controlled by the US (it was the US that engineered a coup in Ukraine in 2014 and ousted the pro-Russia President, Viktor Yanukovich), whereas Russia is ruled by Vladimir Putin with an iron hand. He has complete control of every aspect of Russia, and has been in power for decades. So Putin not only has the economic resource and a higher population with which to wage war, he also has the authority to demand every resource he needs – such as his calling on reserves to serve in the military, as he recently did. Despite reports in the Western press of unhappiness in Russia at the move, there has been no challenge to Putin’s authority.
The West has made it abundantly clear, and on multiple occasions, that it would simply not consider directly entering the war in Ukraine. This has been clarified both by the US and by NATO. The reason is obvious. Russia is a nuclear-armed state with about 7000 nuclear warheads that are armed and ready, as is the US. The last thing the world needs is the two nuclear superpowers to be directly involved in a confrontation. One misunderstanding, and the whole world will cease to exist.
The last point in the list above, regarding China, deserves amplification. The West in general, and the US in particular, ever since Donald J. Trump’s presidency, have viewed China as an adversary and as their number one global rival. The US has seen China through the lens of a zero-sum game. The US has been actively trying to stop the rise of China, the latest indication of which is the US sanctions announced by President Biden on high-tech semiconductors with regard to China. China, therefore, would not want Ukraine, which is merely a proxy for the US, to prevail over Russia, an ally, in this conflict. And so, in the unlikely scenario where Russia, on its own, appears to be losing this war, China will provide enough support to Russia (both economic and military) to prevent this from happening, because if Russia falls into American control, China will be next. That would mean a repeat of Western domination over China, a repeat of the “century of humiliation” that every Chinese learns about in school, and is determined to prevent, at any cost whatsoever. This is seared into the consciousness of every Chinese citizen. Given that China is a superpower, it will be impossible for the West to defeat Russia as long as China is allied with it – unless, of course, as stated above, the US directly enters the conflict. It is true that if the US and NATO were to get directly enmeshed in this conflict, they could defeat Russia militarily – however, such direct intervention carries with it the risk that a Russia that appears to be losing the war will send a few of its hypersonic nuclear weapons to strike at the US mainland, prompting the US to level Russian cities with nuclear weapons from European NATO sites. This is a worst-case scenario (WWIII), and nobody wants it. If China decides to support Russia more directly than it already has so far, the US and Europe cannot retaliate economically against China because of how deeply China is enmeshed with Western economies and with the Western supply chain (explained in greater detail later in this article). A move to retaliate economically against China will destroy the US and Europe completely, even as it terribly hurts the Chinese economy. And so, if at all it seems likely that Russia will lose, either economically or militarily, China will prevent it from losing.
Those Who Forget History...
It is important to emphasize that China intervening to protect its own national security interest vis-a-vis the United States in a military conflict that does not directly involve it has historical precedent. Communist China has always seen the US as its biggest rival and adversary. China has always refused to countenance the presence of American troops on its borders. In 1950, this is what led to the three-year Korean war between the US and China. The North Koreans invaded South Korea and were on the verge of forcing the Americans out of South Korea. At this juncture, General MacArthur came up with a brilliant plan for an amphibious landing at Inchon to encircle the North Koreans. The plan was successful, and MacArthur was able to beat the North Koreans back to the pre-invasion border — the 38th parallel.
 |
| Fig. 007. The Evolution of the Korean War (1950-53) and China's Entry into the War |
But MacArthur was not content with this, and pushed US forces further and further north, until they reached the Yalu river, the border between China and Korea. Mao Zedong had always been clear that he would never tolerate American forces on the Chinese border, and warnings were made diplomatically by China. Unfortunately, these warnings were not heeded by General MacArthur or President Truman.
And therefore, China entered the war in November 1950, sending 300,000 soldiers across the Yalu river and routing the American forces. The Americans had to again retreat south, until MacArthur was replaced by General Matthew Ridgway, who stabilized the front back at the pre-war border, the 38th parallel.
The Korean War cost about 50,000 American lives, but it cost a million Chinese lives. Most of the Chinese troops were lightly armed, with only rifles, as compared to the heavily armed and equipped American troops. But Mao wanted to draw a red line. He had made his point. China would never tolerate America on its borders.
And that is why China will never allow Russia to be defeated militarily or become a Western puppet through a coup. We cannot forget that Russia is actually a buffer state (albeit a giant buffer state) between Europe and China. If the US manages to install a puppet in Moscow, that means that NATO weapons can potentially be stationed on the vast Russia-China border, presenting an existential threat to China. This would be a serious threat to Chinese sovereignty. Thus, the Chinese will do whatever it takes to stop a Western victory in Ukraine. This is why none of the current battlefield reverses (as widely reported in the Western press), such as the Ukrainian takeover of Kherson, really matter. If push comes to shove, the Chinese will throw their considerable weight behind Putin to ensure that Putin does not lose. They simply cannot afford to have an unfriendly government in Russia. They will absorb whatever economic consequences that follow from such a decision, because this is an existential issue.
We must therefore only consider the situations where Ukraine a) either loses this war or b) continues to hang on grimly in a stalemate situation, perhaps even for years, if at all it can hold out for that long. If Ukraine loses this war quickly, there is a possibility that Europe breaks free of America’s influence and quickly mends fences with Russia. In such a scenario, Europe might escape relatively unscathed.
But if this war rages on inconclusively for an extended period (and, in this context, even a war that lasts several more months could be thought of as “extended”), Europe will be utterly destroyed economically. This is the most likely scenario at the current time, as European countries, most perplexingly, have actually hardened their stance despite eight months of a failed combination of economic sanctions against Russia and military aid to Ukraine.
The reason why Europe will be destroyed if this war continues is their extensive dependence on Russia and China. I have so far only alluded to oil and gas, but Europe is so dependent on these two countries that it simply cannot survive with a policy that is hostile to either of these countries. Currently, many major European countries, such as France and Germany, are openly hostile to both countries. This will result in their total economic destruction, unless they reverse course fairly soon.
A Tale of Ineffective Sanctions
Russia is a nation with huge natural resources, and is therefore indispensable to the global economy. Despite this reality, since the start of Russia’s invasion of Ukraine, the West has imposed several rounds of unprecedented economic sanctions on Russia. The stated aim of these sanctions has been “to reduce Putin’s ability to wage war.” Are these sanctions likely to have the intended effect? Let us analyze this.
The main thrusts of the sanctions were along the following directions:
- Western governments seized Russian assets without compensation, such as Russian government assets in Western banks. This is little short of outright theft, and amounted to the seizure of about $400 billion of Russian Central Bank reserves. In addition, assets of influential and wealthy Russian citizens, such as yachts of Russian oligarchs, were also illegally seized by Western governments without compensation. The freezing of the Russian Central Bank reserves was considered by most economists to be an unprecedented measure, almost like a “nuclear option” on the Russian economy. Most Western leaders expected the Russian economy to collapse overnight due to hyperinflation. But the Russian economy recovered after a brief period of high inflation, when the ruble temporarily sharply lost value. But now the ruble is trading at levels which are higher than its levels were before the war began.
- The US and Canada banned the import of Russian oil, gas, and coal. Many other countries voluntarily chose to not import Russian fossil fuels.
- Western countries voted to ban Russia from using the SWIFT payment mechanism. Essentially, this meant that any country that used SWIFT to transfer money to Russia could no longer do so, and that Russia could no longer use SWIFT to transfer money to any other country. The SWIFT ban affected not only trade between the West and Russia, but between any other country, such as India or China, with Russia, because it made it impossible for these countries to pay Russia in dollars for their gas or coal or oil. Russia anyway could not buy anything with these dollars, because most Western markets had been closed to them when SWIFT was made unavailable to Russia. They could not pay India or China or the UAE with dollars to buy goods from them because they had been locked out of SWIFT.
- Some countries banned specific technologies and products. South Korea banned the export of semiconductors, IT equipment, sensors, lasers, maritime equipment, and aerospace equipment, something that was also done by the USA. The EU banned the export of aircraft spare parts to Russia.
- Many companies stopped their operations within Russia – for example, McDonald’s closed down their operations in Russia and sold them to a Russian firm; BP exited its joint venture with Rosneft, in which it had invested $25 billion; and Shell also exited its Russian ventures. Many of these moves were forced, because these companies could no longer do business in Russia without violating Western sanctions against Russia.
- Germany suspended the opening of the Nord Stream 2 pipeline just when construction was complete.
- Western governments sanctioned specific individuals, such as Russian President Vladimir Putin, Foreign Minister Sergei Lavrov, and more than 300 members of the Russian Parliament, the Duma.
- Europe has pondered stopping the buying of Russian fossil fuels on numerous occasions, but has been stopped by practical considerations every time. For instance, on 8 March, 2022, the EU proposed reducing gas purchases from Russia by up to two-thirds by the end of 2022, and completely phasing it out by 2030. On 18 May, 2022, the EU presented an updated plan to completely end reliance on Russian oil, gas, and coal by 2027. Neither of these plans ever got complete agreement, and so were never implemented. A key reason, as we shall see later, is that some countries in Europe are extremely dependent on Russian energy, whereas others are not. On 2 September, 2022, the EU proposed to cap the price of Russian oil so that Russia could not profit from oil sales. In response, Russia said that it would not sell oil to any countries that sought to impose a price cap on it. The price cap would be enforced by denying shipping insurance (by Lloyd’s of London, the leading insurer of maritime shipping) to any vessel that was not complying with the price cap. The price cap on Russian oil was finally agreed to by all EU countries on October 6, 2022, with the price to be finalized on December 5, 2022.
- Australia banned the export of alumina, bauxite, and other aluminum ores to Russia.
- Many countries closed their airspace to Russia, inviting retaliatory closures to their aircraft by Russia.
This is not a comprehensive list, but probably lists the most significant steps. I am not covering the truly silly moves, such as refusing to teach Dostoyevsky in Universities and not allowing Russian sportspersons to participate in competitions. But even many of the measures described above are not that far removed from such silliness. For instance, seizing the yachts of billionaire Russians is highly unlikely to make Putin want to stop his invasion. It is just Western governments being petty. Similarly, sanctioning Putin or Lavrov or members of the Duma has little more than symbolic value. And closing your country’s airspace to Russia is a stupid idea, because when Russia retaliates, it is you who are going to have a much harder time, given how big Russia is.
Incidentally, as the map below shows (created by Artemis Dread, CC BY-SA 4.0
 |
| Fig. 008. How Sanctions Against Russia are a Western Enterprise |
So, keeping that in mind, let us understand what the material and significant aspects of Western sanctions are, before moving on to understand if they can be effective in realizing their aim.
Clearly, freezing half of Russia’s foreign exchange reserves was a major blow to the Russians. But then, by banning Russia from SWIFT, the West escalated things further and made all of Russia’s foreign exchange irrelevant, because they could not use all that money to buy anything.
The banning of Russia from SWIFT was supposed to be the West’s masterstroke. Everyone in the West truly believed that it would bring Russia to its knees. If anything could have crippled the Russian economy, this was it. And indeed, for a short while, these sanctions appeared to have had their effect. Overnight, the ruble crashed and, from a pre-war level of about 79 rubles to the dollar, it fell to nearly 139 rubles to the dollar, before the Russian central bank acted decisively and stopped the rout. Since then, by placing export controls on the ruble and by insisting on payment for gas in rubles, Russia managed to get the ruble back up, and today it trades at a higher level (around 62 rubles to the dollar) than it did before the war. Of course, this level is not terribly useful, because not many rubles are being exchanged for dollars or euros, because nobody in the West is even allowed to trade with Russia, except for the gas and oil sales. But there has been no run on the Russian banks, and the Russian financial system survived the West’s “nuclear strike.”
 |
| Fig. 009. The Fall and Rise of the Ruble After the Invasion of Ukraine, 2022 |
Since then, the Russians have been making money hand over fist, because the price of crude oil and natural gas shot through the roof in Europe. Since Europe was still highly dependent on Russia for natural gas, oil, and coal, some Russian banks were still allowed to use the SWIFT system. Europe was therefore unable to completely stop financing Russia’s war on Ukraine, and in fact Russia made far more money in six months than they normally would make in a year. It is to plug this loophole that Europe is now thinking of placing a price cap on Russian oil. But Russia knows that it has the winning hand here. There is no reason for Russia to agree to any cap on its price, and Putin has clearly told Europe that if any country tries to impose a price cap, he will simply stop selling to that country.
The West seems to be gambling on the idea that Russia needs Europe’s money so badly that they will eventually be forced to agree to the price cap. There doesn’t appear to be any “Plan B” in case Putin refuses to comply with the price cap.
Some of the other sanctions, such as denying Russia high-tech equipment and semiconductors, might eventually hurt Russia, but these are higher-level concerns, and so they will take a long time to start biting. Energy to heat the home and power industry is a far more basic concern. Russia can live without advanced semiconductors; but can Europe live without gas and oil to heat their homes in the winter and to power their industry and cars?
So, what we need to understand is:
- How strong is the Russian economy? How badly will Russia be hurt if Europe, the US, Japan, Korea, Canada, and Australia refuse to buy its fossil fuels? In other words, what is the economic impact of a Western ban on Russian fossil fuels?
- How strong are European economies? How badly will European countries be hurt if they do not have access to Russian fossil energy?
- What other economic levers (other than fossil fuels) exist that can influence the outcome of this economic war?
- What is going to be the effect of all this on the economies of Europe?
- Are there any solutions that can help Europe avoid the worst consequences (such as moving from pipeline gas to LNG, or using renewable energy?)
Indeed, we can turn Clausewitz’s famous words around, because the converse is also true: Economic war is merely the continuation of political and military war with other means. So the West is using economic war against Russia in preference to sending their soldiers to die. They are happy to export weapons to Ukraine and let them do the fighting, but they want to defeat Russia “with other means” — in this case, economic means.
In the next two chapters, we will see if this is possible, and will try to answer the questions posed above.
Key Takeaways from Chapter I
-
The West imposed unprecedented sanctions on Russia after the start of the war
- These sanctions have failed to crush the Russian economy or stop their war effort
- Despite the sanctions, Russia has made huge profits on the sale of oil and gas because of skyrocketing prices
- Russia continues to sell oil and gas to India and China
- The non-Western world did not join in the sanctions
- While the value of the Ruble temporarily dropped, it quickly recovered
- The West has been incrementally adding more sanctions, with little to show for them
- Russia today controls 15-20% of the former territory of Ukraine
-
The Nord Stream pipelines were sabotaged
- They are now unusable and will not be usable for a long time
- Based on motives, the US is the prime suspect behind the sabotage
- The US and NATO have repeatedly ruled out getting directly involved in the war
- China will not let Russia lose either the military or the economic war
- The West is going to try to impose an oil price cap on Russia
- Russia has said that it will stop selling oil to countries that participate in the cap
CHAPTER II: THE STRENGTH OF THE RUSSIAN ECONOMY
Sanctions are Not New to Russia
One of the things that is often missed by Western commentators is the fact that sanctions are not new to Russia. Russia has been sanctioned ever since 2014, when they invaded and annexed the Crimea in response to the US-backed coup in Ukraine that ousted the democratically-elected President Viktor Yanukovich and installed the hand-picked American puppet, Arseniy Yatsenyuk, as President. Yatsenyuk was later succeeded by Petro Poroshenko as President and then by Volodymyr Zelenskyy, who is the curent President. Starting in 2014, the West imposed several rounds of sanctions on Russia. The initial sanctions only consisted of travel bans and some asset seizures against specific individuals. But the Third Round of sanctions, applied on 17 July 2014 by the US, had some wide-ranging measures. This included an embargo on sales of arms and arms-related materials to Russia, a ban on sales of dual-use (civilian/military uses) materials, and a ban on export of equipment related to the oil industry in Russia. The measures also had restrictions on buying of long-term bonds by Russia. In the following months, many European countries followed suit with similar measures, including restrictions on the ability of Russian businesses to obtain medium and long-term loans from European banks. On 11 September 2014, the US imposed restrictions on the Russian oil industry, specifically preventing them from accessing US technology related to oil exploration and banning the sharing of technology between American oil companies and Russian oil companies such as Rosneft, Gazprom, and Lukoil. The US also imposed restrictions on Russia’s largest bank, Sberbank, and a large arms manufacturer, Rostec, limiting their ability to access the US debt markets. On 3 October, 2014, then-US Vice President Joe Biden claimed that the US actions had been hugely successful, when he said, “And the results have been massive capital flight from Russia, a virtual freeze on foreign direct investment, a ruble at an all-time low against the dollar, and the Russian economy teetering on the brink of recession.” VP Biden claimed this even though the ruble had only gone down from around 35 rubles to a dollar to around 40 rubles a dollar. Western sanctions did hit Russia badly, but eventually the ship righted itself: the ruble would eventually go down to as much as 82 rubles to the dollar before eventually settling down to a stable level of about 60 rubles to the dollar in late 2014, which is where the ruble is today in 2022, after the West’s best efforts. Despite Biden’s grandiose claims of “massive capital flight” and the Russian economy “teetering on the brink of recession,” Russia seems to have done quite allright. Biden has clearly not lost his penchant for hyperbole in the last eight years for, after the “nuclear” sanctions imposed by the West in February 2022, whereby Russia’s foreign currency assets were seized and it was barred from SWIFT, he again gloated, in response to the temporary crash in the value of the ruble, saying “the ruble is now rubble.” Of course, rumors of the death of the Russian economy turned out to be vastly exaggerated.
 |
| Fig. 010. How Western Sanctions Affected Russia in 2014 |
So Russia has been subject to sanctions since 2014, and especially on sanctions related to weapons and weapons-related technology. They have had eight years of adjusting to a new way of doing things, of being more self-reliant in terms of technology and defense equipment. This is why the claims of American media commentators that the current sanctions have forced Russians to ransack their washing machines for microprocessors to use in their weapons are ludicrous.
Russia’s Economic Parameters: GDP
While the current (post-February 24, 2022) sanctions on Russia are rightly described as unprecedented, the sanctions of the previous eight years were pretty rough on Russia as well. Let us see how Russia coped under those sanctions, to understand the resilience of the Russian economy and industrial base.
Russia has a fairly advanced manufacturing and engineering base and, in fact, has been spending more on manufacturing as a share of GDP than most European countries over the past decade, with the exception of Germany. Manufacturing constitutes close to 13% of Russia's GDP, as compared with France, Great Britain, and the US, where it contitutes in the range of 9-11% of GDP. So, the idea that Russia is a weak and backward country is ludicrous.
 |
| Fig. 011. Manufacturing as % of GDP, Russia v/s Europe and USA |
That Russia has weathered the sanctions storm it has faced since 2014 rather well is also seen in a comparison of average annual GDP growth rates of Russian and major world economies since 2000, when Vladimir Putin assumed control of Russia. Despite the 2007-8 financial crisis, the US-China trade war of 2018, and various other issues, Russia has clearly outperformed Europe, the UK, and the US.
 |
| Fig. 012. Avg. GDP Growth Rate, 2000-2019, Russia v/s Europe and USA |
You cannot survive eight years of tough sanctions and have a prosperous economy unless you have made adjustments to account for the fact that you will not be able to import many essential products. Despite the ban on weapons technology and dual-use items that has been in force since 2014, Russia still has a viable arms industry. So, to imagine that they will suddenly collapse under the weight of the newer sanctions is delusional.
 |
| Fig. 013. Annual % GDP Growth Rate, 2000-2018, Russia, UK, Germany |
Under Vladimir Putin, Russia has slowly become economically stronger, although it is still a developing country, as its GDP per capita, indexed to purchasing power parity (PPP), shows. While it still has a way to go in catching up to the level of a developed country like the US or a Western European country like France or Germany, the GDP per capita, PPP, has increased by a compounded annual growth rate of more than 3% in the last 20 years under Vladimir Putin (from $14,570 to $29,970, in constant 2017 USD), as the two graphs below show. While Ukraine, too, has grown robustly in these 20 years, the absolute level of Ukraine’s GDP per capita (PPP) is less than half of Russia’s, at $12,944. This is one more reason why we cannot expect Ukraine to hold out too long against Russia.
 |
| Fig. 014. GDP Per Capita, PPP, 2000-2021 |
 |
| Fig. 015. Average % annual growth, GDP per capita, PPP, 2000-2021 |
Russia’s Economic Parameters: Debt-to-GDP Ratio
Another indicator of Russian self-reliance is the total debt-to-GDP ratio, which is the lowest among all the countries in this cohort, by far, close to 20%. This shows how responsibly Russia has managed to develop its economy and industry. Having a low debt-to-GDP ratio means that you are more self-sufficient and independent than other countries. The US is highly indebted (debt around 100% of GDP in 2018, but around 135% today), but is not unduly bothered by this, because it holds the reserve currency, the US dollar. So, whenever a financial crisis hits the country, it prints more paper money, as it started doing since the Global Financial Crisis in 2007, which was caused by inadequate regulation of the US housing market. Since the US dollar is the world reserve currency, other countries invest their surpluses buying US Treasury bonds as a safe investment, and run up huge deposits of US treasuries. Both China and Japan have huge holdings of US Treasury bonds. That’s one reason why Japan’s debt is 200% of its GDP. Other European countries are also highly indebted – the UK’s debt was around 160% of GDP in 2018, and France’s and Spain’s debt were both around 100% of GDP in 2018.
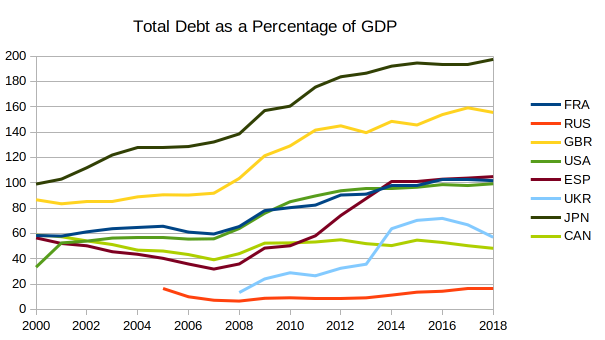 |
| Fig. 016. Total Debt as a Percentage of GDP, for Russia and Various Advanced Countries |
 |
| Fig. 017. The Rise in China and Japan's Ownership of US Treasury Bonds |
The World Bank has done a detailed study of the impact of high debt on the economic health of a country, and has come up with a “tipping point” of 77% for the debt-to-GDP ratio, up to which it is safe to have national debt, and after which the annual GDP growth rate takes a hit of 0.017% for every percentage point that the debt is higher than 77%. Thus, if the national debt is 136% of GDP (and hence 59% above 77%), the reduction in annual GDP growth rate will be 0.017x59 = 1%. Keep in mind that this will be compounded for every year that the national debt is higher than 77%.
Based on this formula, the annual reduction in GDP growth rate caused by the high debt in several countries can be calculated each year. I have done this, and the results can be seen in the next graph.
 |
| Fig. 018. Annual GDP Growth Rate Due to High Debt |
The results are striking. Japan, with a very high level of indebtedness, is losing nearly 2 percentage points of GDP growth each year currently due to its high national debt. The United Kingdom is losing nearly 1.5% of GDP growth each year because of high levels of debt. France, the US, and Spain are all losing nearly 0.5% of GDP growth currently because of high debt.
What is also noticeable is that levels of indebtedness rose dramatically after the Global Financial Crisis of 2007-08, as countries started borrowing to get out of the crisis, powered by the paper dollars of the US and by buying US Treasury bonds. This is only a band-aid approach, and does not address the root cause of the crisis, which was lax regulation leading to criminal malfeasance. The US continued the practice of printing money, also known as “Quantitaive Easing” (QE) for four years, finally stopping it in 2012, after accumulating $4.5 trillion of new assets. When the Covid pandemic hit, the US again resorted to QE in March 2020 to provide relief to Americans. The results of this reckless policy are now becoming evident with skyrocketing inflation in Western countries over the last year. As the old American saying goes, “There is no such thing as a free lunch.” By printing money since 2007, the United States simply kicked the can down the road. But you cannot keep kicking the can endlessly. At some point, you have to pay for it. That point, coincidentally, happened to be almost the same point as the time when Vladimir Putin started his “special military operation” against Ukraine: Russia invaded Ukraine on February 24, 2022; the US Federal Reserve ended Quantitative Easing on March 10, 2022. The US chose the worst possible time for a confrontation with Russia – at a time when its treasury was artificially puffed up. This is because all debt eventually needs interest payments – this is called debt servicing. As long as you are printing more money, it is easy to pay the interest (debt service) on your existing debt. But once you stop the QE, you have to start paying the interest on the debt you owe, and you are not printing any more money. This is the reason for the high inflation in the US.
It is possible to look at the long-term compounded effects of this annual reduction to the GDP growth rate (because of high indebtedness) on the projected GDP after a number of years. I have done this calculation by using elementary compound interest calculation based on yearly compounding, and the results can be seen below in the charts for Japan, Great Britain, and the USA, three countries with high levels of indebtedness.
 |
| Fig. 019. Compounded GDP Growth Factor with Year 2000 as Base, Japan and UK |
 |
| Fig. 020. Compounded GDP Growth Factor with Year 2000 as Base, USA |
Let me explain what these charts mean. The “Id” curve (for “Ideal”) is the value of one dollar of GDP (at the beginning of the year 2000) at the end of any year, based on the reported annual GDP growth rates from 2000 to 2018, by doing annual compound interest calculation. The “Act” curve (for “Actual”) is the value of one dollar of GDP (at the beginning of the year 2000) at the end of any year, but by using the corrected annual GDP growth rates (= reported GDP growth rate – hit on GDP growth rate by using the World Bank formula), again by doing annual compound interest calculation. The point corresponding to each year on the x-axis is the value of the dollar at the end of the year. That is why the value for the year 2000 is higher than 1, because the GDP has grown.
So, what we can infer from these charts is that since the GDP for the USA in the year 2000 was $13.75 trillion (constant 2015 US dollars), the projected value at the end of 2018 based on the reported GDP growth rates would be 1.47 times the 2000 value, but the actual value at the end of 2018, based on the corrected GDP growth rates would be 1.44 times. This may not seem like a big deal at first, but given that they multiply a very large number, the difference is substantial: $413 billion. This is the amount that the USA has lost by having such a large public debt. For reference, the actual ratio of the GDP values for the United States for 2019 and 2000 is 1.45 (which is not surprising, because I have used a simple model of annualized compound interest above, and so one would not expect an exact match.)
The differences for the UK and Japan are much worse. The projected value of $1 of GDP at the start of 2000 for the UK would be $1.41 at the beginning of 2019 based on the reported growth rates and $1.24 at the corrected GDP growth rates. That is a difference of $0.17 per dollar. In absolute terms, that amounts to $393 billion, which is a significant amount for the UK. For Japan, the values are $1.18 and $0.92 (in fact, the model suggests that the Japanese economy is contracting since 2010 because of its huge debt to the USA, because the projected value of $1 is less than $1 from that year onwards), which amounts to $1037 billion, or $1.037 trillion of GDP loss at the beginning of 2019.
Countries which are already highly indebted are not in the best position to get into an extended physical or economic war. Their economies cannot take further blows. The US and European economies are already highly indebted. War (whether military or economic) is a very expensive proposition. The West came out of the Global Financial Crisis not too long ago (2008) and then endured a horrific slowdown because of Covid-19 in 2019-20. Western economies are very fragile, and Western leaders should have thought a thousand times before deciding that military confrontation with Russia was worth it. They appear to have suffered from delusions of overconfidence. What has added to US national debt is the huge spending on the military caused by the 20-year wars in Iraq and Afghanistan, each of which is estimated to have cost America $2 trillion, with the total bill of the American "War on Terror" estimated at $8 trillion.
With such low levels of indebtedness (a debt-to-GDP ratio of less than 20%), Russia is better positioned to survive both a physical as well as an economic war, as well as any economic blockade by the West.
Russia’s Holdings of US Treasury Bonds
It is because of these reasons, and because of the implications of high levels of US Treasury bonds on its national interests, that China began divesting its US Treasury bonds, starting in 2017, when Donald Trump made it America’s enemy number one and started a trade war against China. China realized the danger of having so much of its wealth locked up in US financial instruments. At the time, the US had not yet demonstrated its will to use its Treasury Bonds as a financial weapon yet. But they finally did it when Russia invaded Ukraine, when they froze Russian reserves held in the US. China was worried about it when tensions began to soar with the US under Trump, and the US’ actions with respect to Russia have only confirmed their suspicion. And that is why, since 2017, China has been steadily selling off its holdings of US Treasury bonds. The chart below only shows the values until January 2022, but holdings have continued to drop, and in August 2022, they had gone down to $970 billion from a peak of more than $1.2 trillion. That is a drop of more than 25% in five years. China has been doing this slowly and gradually, because a sharp sell-off would mean a drop in the value and cause them a loss. But it is clearly a carefully coordinated strategy.
 |
| Fig. 021. Reduction in China's Ownership of US Treasury Bonds |
Russia had already faced hostile sanctions from the US, and so it began preparing for America’s economic war well in advance. In the period between October 2017 and May 2018, Russian holdings of US treasury bonds fell from more than $100 billion to less than $15 billion as they sold off most of their holdings.
 |
| Fig. 022. Drop in Russia's Ownership of US Treasury Bonds in 2017-18 |
More recently, between 2000-2022, Russia sold off even more of its holdings of US Treasury bonds, from $12.5 billion to just $2 billion. This was very useful to them when the US decided to freeze Russian assets after the start of the war.
 |
| Fig. 023. Recent Drop in Russian Ownership of US Treasury Bonds |
So, if Russia was reducing its dependence on the US dollar for its reserves, where was it storing its wealth? The answer: Gold. Russian stockpiles of gold have skyrocketed in recent years. From less than 500 tons of gold in 2000, Russia today has a stockpile of more than 2,200 tons. Russia started dumping dollars and buying gold after the financial crisis of 2007-08, a sign that Russia (along with much of the rest of the world) had begun to lose confidence in the West’s financial system. Their purchases and stockpiling (Russia is also one of the top producers of gold in the world) of gold helped their reserves grow by five-fold in the last 20 years. In value terms, Russia’s gold reserves increased from less than $5 billion in 2000 to more than $130 billion by 2022. All this was done to protect Russia against hostile economic moves by the US.
 |
| Fig. 024. Growth in Russian Gold Reserves in Million USD |
 |
| Fig. 025. Growth in Russian Gold Reserves in Tons of Gold |
The rest of the world had reposed their trust in the US by depositing their excess funds in US treasuries. But once the US showed a willingness to weaponize this dependence of other countries by trying to blackmail them, as they have now done with Russia, the rest of the world does not feel their money is safe with the US. As many commentators have reported, there is now a move to “de-dollarize” the world – to do business in currencies other than the dollar and the Euro, and instead move to other currencies such as the yuan, and to use payment mechanisms other than SWIFT, such as the Russian SPFS and the Chinese CIPS.
Russia’s Strength in Armaments Production
Russia has also traditionally had a strong arms industry, second only to the US. Until 2012, the production of arms by the US and Russia was comparable. Since then, there has been a decline, but Russia is still the second-largest arms producer in the world. An indication of this can be seen by looking at the following chart, which shows the top 4 arms exporters in the world. This is obtained from the website of the Stockholm International Peace Research Institute (SIPRI). The values on the y-axis deserve explanation. SIPRI likes to show arms exports not by financial values of exports (because these can vary with supply and demand, and so may not reflect the inherent value of the weapons traded), but by the production cost, which they call Trend Indicator Value. As they explain their methodology on their website,
SIPRI statistical data on arms transfers relates to actual deliveries of major conventional weapons. To permit comparison between the data on such deliveries of different weapons and to identify general trends, SIPRI has developed a unique system to measure the volume of international transfers of major conventional weapons using a common unit, the trend-indicator value (TIV).
The TIV is based on the known unit production costs of a core set of weapons and is intended to represent the transfer of military resources rather than the financial value of the transfer. Weapons for which a production cost is not known are compared with core weapons based on: size and performance characteristics (weight, speed, range and payload); type of electronics, loading or unloading arrangements, engine, tracks or wheels, armament and materials; and the year in which the weapon was produced. A weapon that has been in service in another armed force is given a value 40 per cent of that of a new weapon. A used weapon that has been significantly refurbished or modified by the supplier before delivery is given a value of 66 per cent of that of a new weapon.
 |
| Fig. 026. World's Largest Arms Exporters, 2000-2020 |
Russia’s arms manufacturing capability is another measure of its self-reliance. Unlike most other countries, it does not need to depend on other countries for weapons. Given that it is one of the leading global arms exporters, making weapons for itself, such as aircraft, tanks, and missiles, should not be difficult. This is another reason why sanctions will not hurt Russia’s ability to continue this war. It should be noted that Russia’s arms industry has been under sanctions since 2014, and still has not collapsed, managing to develop and sell several world-leading weapons, so it is fair to say that Russia’s armaments industry has found ways to survive Western sanctions. Ukraine, on the other hand, is highly dependent on the West for its weapons.
In 2021, the US Congress authorized a study to determine the threat to the US from the Russian Defence Industry. Its report (Congressional Research Service report R46937) was released in October 2021. Among the things the report concluded were (quotes from the report):
- Russia’s defense industry is capable of producing advanced systems across most weapons categories.
- Russia’s 2014 invasion of Ukraine and the imposition of Western sanctions reinforced an existing tendency of self-sufficiency, with Russia’s defense industry attempting to become even more self-reliant.
- In 2011, Russia launched a 10-year armament program, known as GPV-2020, with a goal to modernize the military’s weaponry. According to external analysis, the program funding allowed the sector to recapitalize many of its stagnant sectors, import precision tools, recruit a high-quality workforce, increase production, and resume development of R&D programs that had been on hold since the 1990s. According to Russian officials, the defense industry has largely achieved the goals of GPV-2020 and developed capabilities to produce systems across all major weapons categories.
- Russia asserts it has increased its ability to serially produce upgraded systems, increase production volumes, and innovate new designs (such as hypersonic and cruise missiles, electronic warfare, and air defense systems). Analysts generally consider such new systems to be formidable, increasing Russia’s military capability and competitiveness in foreign arms sales.
And so, even as Western media reports since the start of the 2022 Ukraine war suggest that the Russian military is poorly equipped, and that Russian military equipment is outdated relative to that of NATO, the US government clearly knows better. It knows that it is dealing with a state-of-the-art military machine. As CRS R46937 says, Russia’s defence industry has been becoming more and more self-reliant since sanctions were imposed on it after the annexation of Crimea in 2014. This is why it is hard to imagine that the new sanctions imposed in February 2022 will considerably impact Russia’s ability to produce aircraft, tanks, and weapons to continue to prosecute the war. As CRS R46937 notes,
The Russian government and senior government officials have directed an extensive import substitution program to shift the defense industry toward a reliance on domestically produced components. Import substitution could reduce the defense industry’s exposure to foreign sanctions, improve the purchasing power of domestic military expenditure, and increase profit from foreign arms sales. This policy has become more important now that European and U.S. sanctions have limited Russian access from key suppliers and Ukraine has severed access to its defense industry. Russia’s import substitution program has been somewhat successful in replacing Western components and developing domestic manufacturing and production expertise; before 2014, Russia relied on Western producers for dual-use goods, especially high-end technology.
The report also points out that Russia has successfully been able to shake off its reliance on the Ukrainian defense industry:
Russia’s defense industry has been increasingly successful in reducing its reliance on systems and components produced in Ukraine before 2014. Prior to Russia’s invasion of Ukraine, the Ukrainian defense industry provided materiel such as helicopter engines, transport aircraft, rockets and missiles, and gas turbine engines and power components for naval vessels. The loss of Ukrainian engines affected Russia’s shipbuilding, with delays and cancellations of ships under construction. For example, the loss of Ukrainian producers appears to have led Russia to sell Project 11356 frigates to India and to have contributed to delays in the production of Project 22350 Admiral Gorshkov class frigates. Russia has begun to replace imported diesel/gas turbine engines with domestically produced ones.
The US Congressional Research Report also explains why several countries, such as India, cannot abandon or sanction Russia — their defense requirements and weapons inventories are too closely tied to Russia. The report uses data from SIPRI to give the value of arms exports from Russia to several key countries. Below are figures from the report showing Russian arms exports to different countries, using Trend Indicator Values to measure exports.
 |
| Fig. 027. Russian Arms Exports to Algeria, 1991-2020 |
 |
| Fig. 028. Russian Arms Exports to China, 1991-2020 |
 |
| Fig. 029. Russian Arms Exports to Egypt, 1991-2020 |
 |
| Fig. 030. Russian Arms Exports to India, 1991-2020 |
Key Takeaways from Chapter II
- Russia has lived with sanctions since 2014
-
Russia’s economy has grown well even under these sanctions
- Its average GDP growth rate is better than all Western countries
- Average GDP growth rate, per capita, PPP, is better than all Western countries
- Manufacturing is robust at 13% of GDP
-
Russia has a very low debt-to-GDP ratio (20%)
- This makes it very independent
- Russia is capable of absorbing economic shocks
- The West, with much higher debt-to-GDP ratios (of the order of 100% or more) cannot handle more shocks
-
Russia has been making itself independent of the West
- By divesting itself of US Treasury bonds
- By reducing its US dollar holdings
- By investing its wealth in gold
-
By forging a global partnership to de-dollarize
- Other countries like China have also reduced their US Treasury holdings
-
Russia is a major arms manufacturer and exporter
- Technologically independent of the West
- Has a greater ability to continue war than Ukraine
- Modern and competitive with the West, according to US assessment
- Shown an ability to survive severe Western sanctions since 2014
CHAPTER III: RUSSIA’S INTERCONNECTEDNESS WITH THE WORLD
Normal trade embargoes work well if you can choke another country which is in desperate need of something and cannot get it because of your embargo. A prime example of this is the Pacific War in the Second World War, which was triggered because the US imposed a trade embargo on Japan because of its invasion of China in 1933. Japan had a vision of imperial conquest of Asia, which was unacceptable to Great Britain and the USA, because it conflicted with the imperial visions of these two empires. Japan needed raw materials even to sustain its empire in Manchuria. The American embargo was preventing the Japanese from buying vital raw materials to sustain its ambitions. The only way to break the embargo was prosecute war against the US and Great Britain. Japan’s immediate problem was Great Britain, because they could get most of their raw materials from East Asia, specifically Malaya and the Dutch East Indies (modern Malaysia and Indonesia). But they were worried about the naval power of the US and knew they had to knock them out. The result of that calculation was the attack on Pearl Harbor on December 7, 1941. Unfortunately for the Japanese and fortunately for the rest of the world, their calculations went wrong, and they could not hit the American aircraft carriers at Pearl Harbor because those had previously sailed out and therefore escaped the carnage of the surprise attack. This left the Americans with enough naval strength to defeat the Japanese on the high seas.
But the current situation involving Russia is an embargo in reverse. The West does not want to deny Russia goods. They want to deny them income. The embargo on Japan was fairly easy, because Japan wanted to import iron ore, coal, rubber, tin, zinc, and a host of other materials that their small island could not produce. Russia, on the other hand, produces gigantic quantities of commodities. They need markets for their commodities. The West believes that by not allowing Russia to sell these commodities, they can starve Russia of the income it would derive from selling these commodities. The US had earlier done this with Iraq after the 1991 Gulf War, where it refused to allow Iraq to sell its oil; and it has imposed similar sanctions on Iranian oil today. But while the sanctions on Iran have caused hardship, decades of sanctions against the Islamic regime in Iran have not succeeded in removing them from power or seriously eroded their support among the people. (It is true that there is currently some unrest in Iran, but it is unrelated to the US sanctions.)
The question then becomes: who needs whom more? Does Russia need the income from selling commodities more than the West needs the commodities themselves?
There are two sub-questions here:
- Can a complete embargo on Russian sales of its commodities be imposed?
- If a complete Western embargo could be imposed on Russia’s energy sales, could Russia survive?
Trade Imbalances and Export/Import Ratios
To understand this, we need to understand a concept known as the trade imbalance. The trade balance of a country (also known as the Balance of Trade, or BoT) is defined as the value of its exported goods and services minus the value of its imported goods and services. If the value of the exports exceeds the value of the imports, the country is said to have a trade surplus. If the value of the imports exceeds the value of the exports, the country is said to have a trade deficit. These quantities can be defined for a country as a whole (with respect to the rest of the world) or for a country with respect to a region (for instance, for Russia with respect to Asia) or for a pair of countries (for instance, for Russia with respect to Germany).
If one country has a trade surplus with respect to another country, then that means that the first country sells more to the second country than the second country sells to the first. In such a case, it is meaningless for the second country to try to have a trade embargo with the first country, because if trade between the two countries is stopped, it is the second country that will suffer more without the goods from the first country.
Any country that has a trade deficit with respect to another country cannot realistically impose a trade embargo on the other country.
A second metric that is useful to understand trade imbalances is the export to import ratio. While the trade balance is an absolute number, and can depend on the sizes of the two economies involved, the export/import ratio (Exim ratio) is a normalized way to understand trade imbalances. If Russia’s Exim ratio with respect to another country or entity (like the EU or Asia) is greater than 1, it means that Russia is exporting more to that country than it imports from it. In other words, Russia has a trade surplus with that country or entity. If it is less than 1, it means that Russia is importing more from that country than it exports to it. In other words, Russia has a trade deficit with that entity.
Let us examine Russia’s trade balances with the world, with different regions, and with other countries The figure below shows Russia’s Balance of Trade (BoT) with the world as a whole and with the Euro Area (data from the International Monetary Fund). It can be clearly seen that Russia enjoys a healthy trade surplus with both the rest of the world and Europe. As of 2020, this surplus with the rest of the world amounted to $106 billion and with Europe amounted to $29 billion. That means Europe bought $29 billion worth of goods and services more from Russia than Russia did from Europe, and the world bought $106 billion worth of goods and services more from Russia and Russia bought from the rest of the world.
 |
| Fig. 031. Russia's Trade Surpluses with the entire World and the Eurozone, 2000-2020 |
The next figure shows Russia’s Exim ratios with the World and the Euro region.
 |
| Fig. 032. Russia's EXIM Ratios with the entire World and with the Eurozone, 2000-2020 |
We can see that, while the Exim ratio has been reducing over the last 20 years, it is still pretty high at 2020, at 1.5, with both the world and the Euro region, indicating that Russia is exporting 1.5 times to the rest of the world what it is importing from it, and the same with respect to Europe. This indicates that Russia is an extremely important trade partner for Europe as well as the rest of the world, and explains why the rest of the world is extremely reluctant to abide by Washington’s dictates telling them to stop doing business with Russia. Most countries cannot stop trading with Russia. Their economies would collapse. Europe is a wealthier continent than Asia or Africa, so even though Europe’s leaders know that Europe would suffer with a boycott of Russian goods, they are willing to endure it in the short term if it can help defeat Russia in Ukraine. In effect, they are trading prosperity for ideology.
It is also instructive to see how this trade imbalance is distributed between different countries in Europe. This can be seen from the following graph.
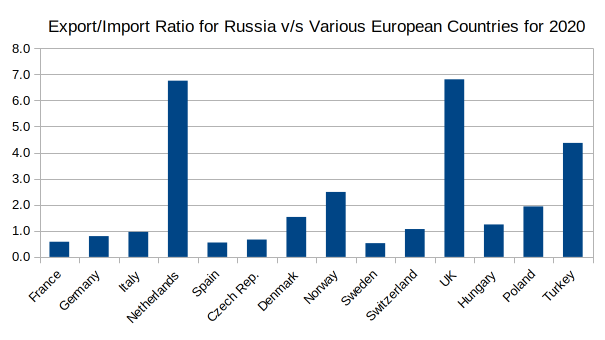 |
| Fig. 033. EXIM Ratios for Russia with Various European Countries in 2020 |
This is an interesting chart, and makes us wonder: what is the reason for these huge differences between countries? France and Germany clearly export more to Russia than they import from it; Italy exports as much as it imports; Spain, the Czech Republic, and Sweden all export more to Russia than they import from it; and the other countries in this graph import more from Russia than they export to it. The examples of the Netherlands and Norway are particularly interesting, because both countries are energy-rich. The Netherlands has huge gas fields at Groeningen, and Norway is a huge energy surplus country. What could they possibly be importing from Russia?
To understand these differences, it helps to look at a breakup of the import and export numbers. The Observatory of Economic Complexity (OEC) at MIT helps us do this. Let us look at the details from Norway.
 |
| Fig. 034. Breakup of Russia's Exports to Norway, 2020 ($1.1 Bn) |
What we see, contrary to the stereotypes have been fed in popular media, is a very mixed picture. About 20% of energy-rich Norway’s imports from Russia are crude oil and refined petroleum (diesel and petrol), about 5% is natural gas (“petroleum gas”), and about 2.5% are coal-based products, including raw coal. Fuels only form 27.5% of a total import bill of $1.1 billion, or about $303 million. A wide variety of items comprise the remaining $800 million in the list, some of which are raw materials and some of which are finished goods: about 16.3% is rapeseed oil; nearly 10% is raw aluminium; nearly 5% is nickel matte, an intermediate metallurgical product (nickel sulfide) in the processing of nickel ore; ammonia (6.5%); soybean meal (2.3%); fertilizer (around 1%); wheat gluten (3.3%); rubber tires (3.1%); carbon-based electronics (0.64%), special-purpose ships (1%), prefabricated buildings (0.83%); refrigerators (0.32%); and a host of other items form the balance. The presence of so many non-fuel related items tells us that when US Senator John McCain called Russia “a giant gas station,” he had no idea what he was talking about. Russia is a diversified economy with much more than gas and oil to it. As already mentioned, it has a strong manufacturing sector.
The Green Transition and the Role of Gas
The obvious question one would have on reading the previous paragraph is why exactly a country like Norway, with extensive oil and gas reserves, would even import oil and gas from Russia. The answer lies in Europe’s persistent efforts to decarbonize over the last 30 years – a journey in which cheap Russian oil and gas have played an oversized role. Simply put, cheap oil and gas from Russia has fueled Europe’s transition from highly polluting coal to green technologies, such as wind and solar energy, by cushioning the impact of the transition. Indeed, if one looks at the percentages of power produced in Europe by different means over the last 30 years, one sees that the share of renewables and biofuels has gone up dramatically, whereas the share of fossil fuels has dramatically dropped over this period. Russia’s supply of cheap gas as a transition fuel has been crucial to this transformation.
.png) |
| Fig. 035. Proportion of Various Means of Energy Production in Europe, 1990-2020 |
Green technology costs money to develop, and the incredibly cheap rates at which Russia has been supplying gas to Europe has meant that even energy surplus countries like Norway could start investing in green technologies. Today, only 58% of Norway’s energy comes from fossil fuels, as can be seen from the figure below. (Source for data: The European Commission’s Eurostat website.)
 |
| Fig. 036. Percentage Breakup of Norway's Energy Sources, 2020 |
As seen from the previous image on Europe’s primary energy production over the last 30 years, the greatest reduction has been in the use of highly polluting coal, the use of which has gone down from 13,000 PetaJoules (a Joule is the Système International, or SI (International System), unit of energy; one Petajoule is 1000 trillion joules) to about 3,000 PetaJoules. This can also be seen in the graphic below.
 |
| Fig. 037. The Decline of Coal in Europe Over the Last 30 Years |
Essentially, cheap Russian gas has helped Germany completely phase out coal, and has reduced overall coal consumption in 2020 to 20% of the levels that were consumed in 1990.
Russia has made Europe’s transition to a green economy possible.
However, the journey is as yet incomplete. Even with all this help from Russia, the adoption of renewable technologies in Europe is still very inadequate, as can be seen below.
 |
| Fig. 038. Fossil Fuel Dependence of Major European Nations, 2020 |
While a couple of countries in the chart above (Finland and Denmark) are close to the 40% level of renewables adoption, many are still in the 10%-20% range of adoption. Fossil fuels still loom large over the European landscape. And, as we shall soon see below, Russia is a huge part of that fossil fuel dependence. It is the economic advantage that Russia provided Europe with its supply of cheap gas that made even this 10%-40% dependence on renewables possible, but that transition clearly still needed a few decades to be complete. The present war, brought upon by European refusal to accept Russia’s legitimate concerns about their encirclement by NATO, is going to set back three decades of progress in Europe’s move to a green future. Natural gas is an essential part of that transition, and that is why wise German leaders like Gerhard Schroeder and Angela Merkel worked closely with Russia to build, first, the Nord Stream 1 gas pipeline, and later, the Nord Stream 2 gas pipeline – which Germany has now foolishly abandoned under American pressure.
That is why hopes of a rapid transition from fossil fuels to renewables to overcome Europe’s dependence on Russia in an extremely short time frame are overly optimistic.
Destinations of Russian Exports and Origins of Russian Imports
We can investigate where Russia exports the majority of its goods and services to. This can be seen in the graphic below. Most of Russia’s exports in 2020 flowed to Europe, with a value of $160.9 Bn. Closely following Europe was Asia, with $138.8 Bn. The other continents’ shares are small in comparison.
 |
| Fig. 039. Breakup of Russia's Exports by Destination Continent, 2020 |
A similar chart can also be ploted of Russian imports by continent of origin. Again, Europe is the main continent of origin of Russian imports, with $111.1 Bn in imports, followed by Asia, at $93.6 Bn. The other continents are minor.
 |
| Fig. 040. Breakup of Russia's Imports by Origin Continent, 2020 |
Clearly, Europe is Russia’s leading trading partner, both for imports and exports, and is closely followed by Asia.
We can drill down deeper into this to find out who the major recipients of Russian exports are in Europe and in Asia. The next two charts show this.
 |
| Fig. 041. Key Destinations for Russian Exports in Asia, 2020 |
China is, by far, the biggest destination for Russian exports in Asia, at 35.5% of the total exports ($49.3 Bn), followed by neighbor Kazakhstan (10%, $13.8 Bn), Turkey (9.4%, $13.1 Bn), and South Korea (9%, $12.5 Bn), Japan (6.7%, $9.3 Bn) and India (4.3%, $5.9 Bn).
 |
| Fig. 042. Key Destinations for Russian Exports in Europe, 2020 |
In Europe, the UK leads the pack for 2020, at nearly 16% (15.7%, $25.3 Bn), followed by the Netherlands (14.5%, $22.5 Bn), Belarus (9.8%, $15.8 Bn), Germany (8.8%, $14.2 Bn), and Italy (7.4%, $11.9 Bn) to complete the top 5. The distribution of exports to European countries is more uniform than that in Asia, and this is because a big component of Russian exports to Europe is fuel, and all countries need fuel for home heating, industrial heating, and chemicals production. This is because Europe as a whole is a cold continent that is highly developed, with high energy needs.
Let us, similarly, look at the distribution of imports. The next figure shows the main import origins for Russia among Asian countries.
 |
| Fig. 043. Key Origins for Russian Imports in Asia, 2020 |
China is by far the biggest source of imports for Russia among Asian nations, at 54.2% ($50.7 billion). The contribution of the other countries is much lower: South Korea (8.5%, $7.9 Bn), Japan (6.0%, $5.6 Bn), Kazakhstan (5.5%, $5.2 Bn), and Turkey (4.8%, $4.5 Bn), to round off the top five.
 |
| Fig. 044. Key Origins for Russian Imports in Europe, 2020 |
In Europe, Germany is the dominant source of imports for Russia, at 23.5% ($26.1 Bn). The distribution of imports is not as well-distributed as the distribution of exports among European countries. Russia’s connection with Germany is extremely strong – the two countries are highly dependent on one another, both in imports and exports. Belarus follows at 11.5% ($12.8 Bn), followed by Italy (6.9%, $7.7 Bn) and Poland (6.9%, $7.6 Bn), Netherlands (5.8%, $6.5 Bn), and France (5.4%, $ 6.0 Bn).
Another way to understand Russia’s connection with the rest of the world is to look at the Tree Level map of Russia’s exports (by destination) and imports (by origin) provided by the OEC lab at MIT. These are shown below:
 |
| Fig. 045. Tree Map of Russia's Export Destinations in 2020 (Total $330 Bn) |
 |
| Fig. 046. Tree Map of Russia's Import Origins in 2020 (Total $220 Bn) |
While this provides a macro view, it is sometimes more useful to examine bilateral relations. The export/import ratio (Exim ratio) provides a very good way of understanding Russia’s importance to the rest of the world. The graph below shows Exim ratios of Russia with various Asian countries.
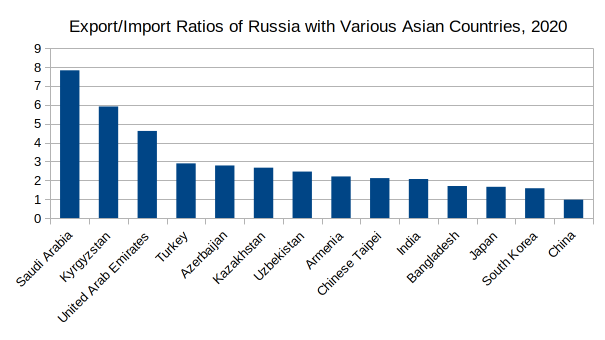 |
| Fig. 047. EXIM Ratios of Russia with Various Asian Countries, 2020 |
Let’s now look at Russia’s Exim ratios with European countries.
 |
| Fig. 048. EXIM Ratios of Russia with Various European Countries, 2020 |
Again, with the exception of France, Germany, Czechia, and Lithuania, most European countries are heavily dependent on Russian imports. Even France and Germany are fairly dependent. The Exim ratio hides the fact that absolute trade numbers in both directions are extremely high. For example, France imports $4.93 billion worth of goods and services from Russia and exports $5.97 billion worth of goods and services back to Russia. Germany imports $14.2 billion worth of goods and services from Russia and exports $26.1 billion worth of goods and services to Russia. These are huge dependencies, and if Russia is suddenly blocked from trading with Europe, these supply deficiencies are very hard to fill.
Finally, let us look at Russia’s Exim ratios with the countries of the African continent. Because many of these countries are so dependent on Russia, I have been forced to use three graphs with different scales to be able to show all the dependencies.
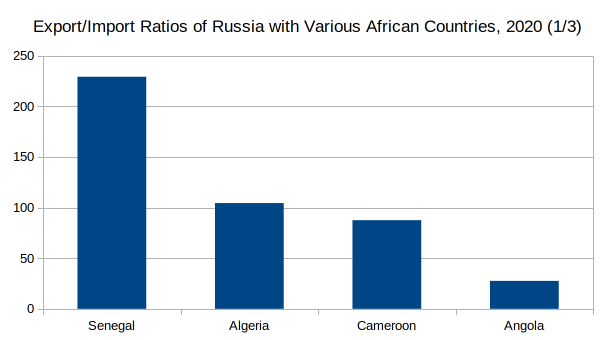 |
| Fig. 049. EXIM Ratios of Russia with Various African Countries, 2020 (1/3) |
 |
| Fig. 050. EXIM Ratios of Russia with Various African Countries, 2020 (2/3) |
 |
| Fig. 051. EXIM Ratios of Russia with Various African Countries, 2020 (3/3) |
Just one look at these graphs should help the reader understand why most Asian and African countries abstained from UN resolutions criticizing or condemning Russia. They are too dependent on Russia for so many of their needs, and they cannot risk alienating Russia by criticizing them. This also explains why, when Russia organized the Eastern Economic Forum at Vladivostok recently, representatives of 60 countries attended the summit. Trying to isolate Russia diplomatically or economically is, therefore, a non-starter.
Looking at Exim ratios also helps us understand why Belarus is such a close ally of Russia, and why Turkey is careful not to jeopardize its relationship with Russia while still being part of NATO, a fact that has helped it in the role of a peacemaker. It also explains why Saudi Arabia refused to go along with Washington’s diktat to increase production of crude to lower prices, because such a move would reduce oil prices, and Russia did not want prices to go down further.
To see the diversity of Russia’s economy, let us look at the tree view of Russia’s exports in the year 2020.
 |
| Fig. 052. Breakup of Russia's 2020 Exports by Category (Total: $330 Bn) |
From the tree view of Russia’s exports, we see that of the $330 billion that Russia exported in 2020, $166 billion, or 50%, are of mineral products, consisting of crude oil, refined petrol, natural gas, coal, iron ore, coal tar oil, and a few other ores and mineral products. About 11.2%, or $37.1 billion comprise of metals, mainly copper, iron, aluminium, nickel, both in raw and finished forms, such as wires and pipes. Precious metals form the third big category in Russia’s exports, comprising $33.5 billion, or 10.2%. The main exports in this category are gold (5.7%) and platinum (3.2%). These are followed by chemicals ($18.7 Bn, 5.7%), agricultural products (mainly wheat) ($14.5 Bn, 4.4%), machinery ($12.7 Bn, 3.8%), wood products ($8.4 Bn, 2.6%), foodstuffs ($7.4 Bn, 2.2%), plastics and rubbers ($6.6 Bn, 2%), animal products ($5.7 Bn, 1.7%), transportation (cars, ships, planes, trucks, etc., and their parts) ($5.1 Bn, 1.5%), paper goods ($4.4 Bn, 1.3%), animal and vegetable by-products (mainly seed oils) ($4 Bn, 1.2%), stone and glass products ($1.6 Bn, 0.5%), instruments ($1.5 Bn, 0.5%), textiles ($1.2 Bn, 0.4%), footwear ($265 Mn, 0.08%), weapons ($192 Mn, 0.06%), animal hides ($192 Mn, 0.05%), arts and antiques ($24 Mn, 0.007%), and miscellaneous items ($963 Mn, 0.3%).
To see this better, it is better to understand Russia’s substantial exports that exclude the fossil fuel piece (that form 50% of exports) and the metal and metal ore piece (that form 11.2%). The balance comes to a hefty $127 billion, and can be seen graphically below.
 |
| Fig. 053. Percentage Distribution of Non-Fuel and Non-Mineral Russian Exports by Category, 2020 (Total $127 Bn) |
The share of fossil fuels in Russia’s exports has remained relatively unchanged in the last 20 years, around 50%, as this graphic from the year 2000 shows.
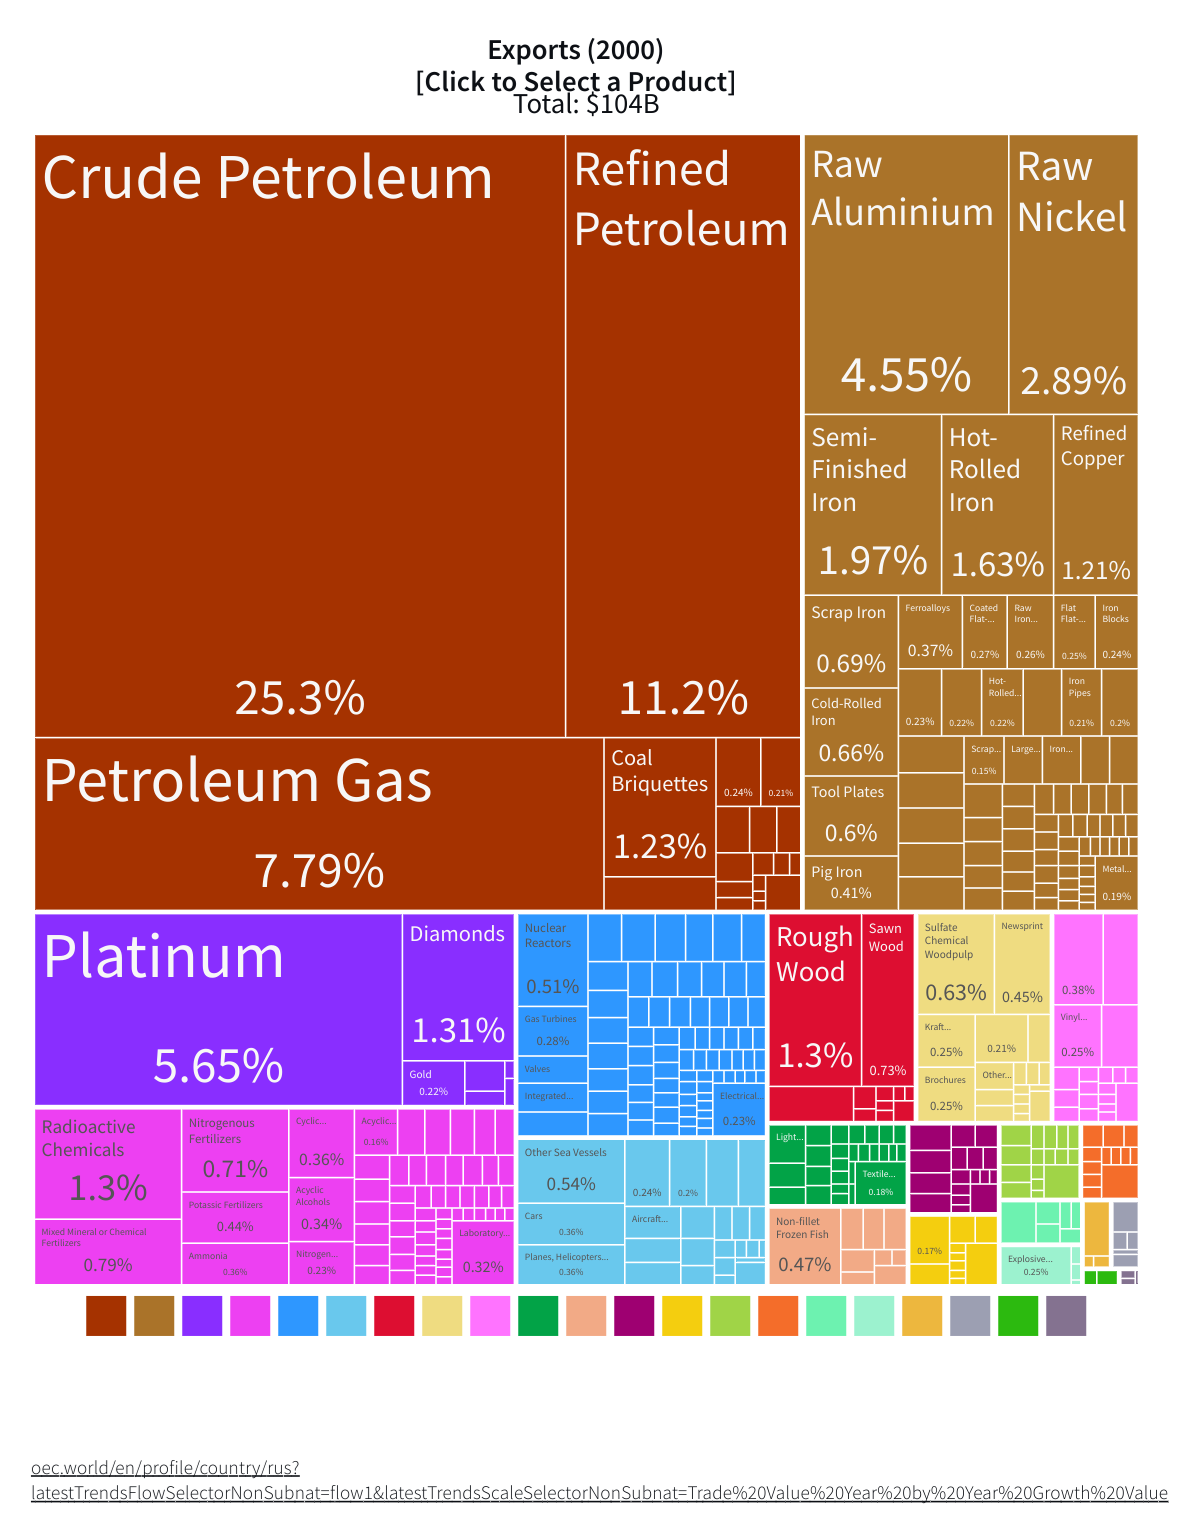 |
| Fig. 054. Breakup of Russia's 2000 Exports by Category (Total: $104 Bn) |
Russia’s exports have grown at a healthy compounded annualized growth rate (CAGR) of about 4%, which is better than that of the leading European countries as well as the US, as the following chart shows. Since the share of fossil fuels in Russia’s exports has remained relatively unchanged in the last 20 years (about 50%), this means that the non-fossil-fuel pieces of its exports are also growing at a compounded annualized growth rate of 4%.
 |
| Fig. 055. CAGR of Russia's Exports, 2000-2020 |
The tree view of Russia’s exports is very important to understand in light of Europe’s economic sanctions so far. There has been an inordinate amount of attention given to natural gas in the last nine months, and much energy has been expended on various fora, television channels, and press conferences on why a blockade of Russia’s gas sales must be achieved to “stop Russia’s ability to wage war.” But, as the graph above shows, natural gas (“petroleum gas”) only formed about 6% of Russia’s $330 billion worth of exports in 2020. How would preventing Russia from selling gas, even if it were possible to achieve this, “stop Russia’s ability to wage war?” It makes you wonder if Western politicians understand even the basics of economics and international trade before making important policy decisions.
Furthermore, the chart shows that even oil only amounts to 37% of Russia’s sales ($122 billion). Given that China and other countries outside Europe are not interested in sanctioning Russia, in light of their dependence on Russia, as mentioned earlier, how much of this can realistically be sanctioned? The OEC site again comes to our rescue. From the OEC site data, we can see that in 2020, Russia exported 45.1% of its crude oil to Asia, and 53.1% to Europe. Taking this to be the figure for both crude oil and refined petroleum (just to get an estimate), we can see that of the $122 billion worth of crude oil and refined petroleum that Russia exported in 2020, $55 billion was exported to Asia and $65 billion was exported to Europe. That amounts to just 19.7% of the total Russian exports of $330 billion. Similarly, the total export of natural gas from Russia in 2020 was 6% of $330 billion, or $19.8 billion. Again, from the OEC site data, we can see that 72% of Russia’s total gas output goes to Europe. Thus, the value of the natural gas exported by Russia to Europe is $14.3 billion. This is only 4.3% of Russia's total exports of $330 billion. Thus, even if Europe managed to block all exports of oil and gas from Russia to Europe, the total value would be $79.3 billion. This amounts to only 24% of Russia’s total exports. Clearly, this is not a fatal blow to the Russian economy. The real question, though, which we will explore further on in this article, is: how big a blow is it to Europe’s economies? (I have assumed, of course, that all of Europe will block Russian fuels, and that all of Asia will accept Russian fuels, and this is not accurate. For example, Japan and Korea will not buy Russian fuels, even though they are in Asia; but on the other hand, Belarus, which is in Europe, is a big recipient of Russian fuels, as is Hungary. So for a rough approximation, this analysis is good enough.)
 |
| Fig. 056. Russia's Oil Exports by Destination, 2020 |
 |
| Fig. 057. Russia's Natural Gas Exports by Destination, 2020 |
How does the West plan to bring Russia to its knees by just preventing it from exporting a fourth of its exports? Has anyone in Europe done even basic checking of economic data before going ahead with sanctions?
Back to TOC
The China-Russia “No Limits” Partnership
Given the strong connections between Russia and certain countries, as seen in the preceding paragraphs, it might be worth, in concluding this section, to examine certain bilateral trade relations. Of special interest is Russia’s trade relationship with China, given that China is both Russia’s leading export destination as well as the origin of most its imports. The figure below shows the breakup of Russia’s $49.3 billion exports to China.
 |
| Fig. 058. Category-wise Break-up of Russia's Exports to China (2020) |
Crude oil and refined petroleum make up 52.7% of Russian exports to China. Gas adds another 2.6%. These are extremely important to China, as it seeks to economically develop its hinterland in the West of China. Of greater interest is the map of imports of goods from China into Russia. This is a very diverse map, and show that Russia will be able to get practically anything they want from China in exchange for the oil that they can provide to fuel China’s growth, at discounted rates. This means that Russia can completely substitute imports from Europe with imports from China, especially because manufacturing capacity in China is practically limitless and will continue to increase as it continues to develop the country in the West. To get an idea of the diversity of the imports from China into Russia, a sample of the items in the list (the list has 1,060 items) are broadcasting equipment for $4.63 billion; computers for $2.83 billion; motor vehicle parts for $930 million; cars for $456 million; medical instruments for $417 million; large construction vehicles for $384 million; microphones and headphones for $384 million; spark-ignition engines for $380 million; video recording equipment for $342 million; rubber tires for $337 million; knit socks and hosiery for $330 million; integrated circuits for $281 million; centrifuges for $256 million; special purpose ships for $258 million; carbon-based electronics for $197 million; transmissions for $178 million; semiconductor devices for $171 million; vaccines, blood, antisera, toxins, and cultures for $151 million; electric batteries for $191 million; brooms for $185 million; fork lifts for $112 million; industrial printers for $108 million; bicycles for $100 million; antibiotics for $98 million; plastic pipes for $98 million; toilet paper for $95 million; processed fish for $76 million; onions for $77 million; processed mushrooms for $70 million; pens for $67 million; knit T-shirts for $65 million; knit women’s undergarments for $65 million; plastic wash basins for $61 million; gas turbines for $56 million; copper pipe fittings for $56 million; fruit juice for $54 million; buses for $44 million; electromagnets for $41 million; tea for $39 million; carboxyamide compounds for $35 million; disc chemicals for electronics for $26 million; electric musical instruments for $24 million; styrene polymers for $11 million; friction material for $4.1 million; steam turbines for $3.96 million; copper wire for $3.37 million; microorganism culture preparations for $2.27 million; photocopiers for $1.2 million; railway track fixtures for $0.64 million; nuclear reactors for $0.3 million; and raw iron bars for $0.12 million. In terms of categories, out of the $50.7 billion worth of goods that China exported to Russia in 2020, the following was the breakup:
- Machinery for $22.9 billion
- Textiles for $5.35 billion
- Metal manufactured items for $3.77 billion
- Chemicals for $2.94 billion
- Transportation (Motor vehicles, ships, aircraft, and their parts) for $2.63 billion
- Plastics and rubbers for $2.58 billion
- Footwear and headwear for $1.75 billion
- Instruments for $1.73 billion
- Stone and Glass items for $881 million
- Foodstuffs for $668 million
- Agricultural products for $680 million
- Items made from Animal Hides for $472 million
- Paper goods for $435 million
- Animal products for $272 million
- Mineral products for $195 million
- Wood products for $127 million
- Jewellery and Precious Metals for $60.2 million
- Paintings and Sculpture for $9.82 million
- Animal and Vegetable By-Products for $7.8 million
- Weapons for $1.35 million
- Miscellaneous Items for $3.42 billion (including Other Toys, Light fixtures, Seats, Sports Equipment, Party Decorations, Other Furniture, Brooms, Pre-Fabricated Buildings, Mattresses, Pens, Zippers, Vacuum Flasks, Fishing and hunting equipment, Medical furniture, Video and Card games, Lighters, Scent Sprays, Combs, Pencils and Crayons...)
China is a one-stop shop for Russia, and can provide anything Russia needs in return for crude oil and refined petroleum and, increasingly, after the operationalization of the Power of Siberia gas pipelines, natural gas.
 |
Fig. 059. Category-wise Break-up of China's Exports to Russia in 2020 (Total: $50.7 Bn) |
It is important to note that the relationship between China and Russia is more or less equal in monetary terms. Russia’s exports to China are worth $49.3 billion, whereas it imports $50.7 billion from China. But the relationship is more important than the monetary values indicate. China is getting a dedicated source of energy that is vital to the complete modernization of the whole of China. The opportunity cost of getting the same energy from the open market would be very high for China. China gets Russian energy at a significant discount to the market price, and would like to have this supply for at least a decade, if not two, as it does two things simultaneously: develops its less-developed regions, and moves to renewable sources of energy. In fact, the sanctions applied on Russia after the start of the war mean that while oil and gas become extremely expensive in the world, they remain cheap for China. This allows China to have a competitive advantage with respect to Europe and the USA, and should help it tremendously in its rise to the top. This energy supply line is also immune to Western sabotage attempts, because it lies entirely within Russian and Chinese-controlled territory. It is quite likely that this was the topic of discussion when Vladimir Putin went to see Xi Jinping in Beijing on February 20, just four days before the invasion of Ukraine, during the Beijing Winter Olympics — to ensure that this special relationship between Russia and China would continue in spite of any sanctions the West might impose on Russia in retaliation for its invasion of Ukraine. And clearly, judging not only from Xi’s response in February but also China’s consistent support for Russia since the invasion, that agreement has been set in stone — the agreement to ensure that Russia will be impervious to Western sanctions in exchange for Xi getting guaranteed energy to develop China will hold no matter what happens.
This is what is meant by the “no limits” friendship between Russia and China. Their trade ties are so strong and so mutually beneficial that no matter what sanctions the West seeks to impose on Russia, the people of Russia will not lack anything.
A Detailed Look at Some Bilateral Relations
Some other relationships are also worth investigating after seeing the previous graphs. For instance, why does Russia have such a high Exim ratio with the Kingdom of Saudi Arabia (KSA)? The tree view from OEC helps us understand this.
 |
| Fig. 060. Break-up of Russian Exports to Saudi Arabia by Category, 2020 ($1.58 Bn) |
Barley is a big component of Russia’s export to the KSA, forming 33% of the total import bill of $1.58 billion for Saudi Arabia. Agricultural products make up 37% of the KSA’s imports from Russia. For an oil producer like Saudi Arabia, the fact that it imports so much refined petroleum from Russia also suggests that the KSA only extracts crude oil and does not refine much of it. The rest of the products from Russia are mixed, with metals (12%) and food items (7%), including, prominently, chocolate, being big imports. In return, the KSA does not have much to offer Russia, with their exports to Russia only amounting to $202 million.
 |
| Fig. 061. Break-up of Exports from Saudi Arabia to Russia by Category, 2020 ($202 Mn) |
Russia’s exports to the UAE are also very interesting. As in the case of the KSA, refined petroleum forms a big part of the UAE’s imports, suggesting that they do not refine much of the oil they extract. This highlights an important aspect in which Russia is very different from other major energy producers such as Saudi Arabia and the UAE. Russia is an advanced nation and so has the technology to do downstream processing of crude oil and natural gas. That is why it has the abiity to do the refining of crude oil as well as the chemical conversion of natural gas to ammonia and fertilizers. Because of this, it is able to export refined petroleum even to major oil producers.
 |
| Fig. 062. Break-up of Exports from Russia to the UAE by Category, 2020 ($2.59 Bn) |
Two important commodities feature in the import list: diamonds, at nearly 31% of a $2.59 billion import bill, and wheat, at 5.7%. This tells us something about the diversity of Russia’s strength in commodities, something we shall return to in a later part of this article. Wheat, diamonds, and barley are all commodities in which Russia is a world leader.
The UAE’s exports to Russia are much smaller ($561 Mn) and more spread-out.
 |
| Fig. 063. Break-up of Exports from the UAE to Russia by Category, 2020 ($561 Mn) |
Let us next look at Turkey, another nation which has a significant trade deficit with Russia. The next figure shows the composition of Russia’s exports to Turkey.
 |
| Fig. 064. Break-up of Russian Exports to Turkey by Category, 2020 ($13.1 Bn) |
Turkey relies very heavily on Russia both for fossil fuels (35%), metals (28.3%) and agricultural products (17.3%) in its $13.1 billion imports from Russia. Russia’s imports from Turkey, in contrast, only amount to $4.5 billion and are extremely diversified. It is this dependence on Russia that is the reason for Turkey’s refusal to take a hard line on Russia — not only after the Ukraine invasion, but even before it, when Washington tried to pressure it not to buy Russian S-400 air defense systems.
 |
| Fig. 065. Break-up of Exports from Turkey to Russia by Category, 2020 ($4.5 Bn) |
A look at Russia’s exports to and imports from Kazakhstan explain why Russia has such a huge trade surplus with Kazakhstan.
 |
| Fig. 066. Break-up of Russian Exports to Kazakhstan by Category, 2020 ($13.8 Bn) |
Russia’s exports to Kazakhstan are very diverse, covering everything in the spectrum. Russia is essentially the main provider of all of Kazakhstan’s needs.
 |
| Fig. 067. Break-up of Exports from Kazakhstan to Russia by Category, 2020 ($5.18 Bn) |
In contrast, Kazakhstan is mainly a supplier of mineral sources, mainly metals and uranium, of which Kazakhstan is the world’s largest producer, producing 40% of world supply. The landlocked country depends completely on Russia and is completely within Russia’s orbit.
What we see is that even though fossil fuels are one of Russia’s chief exports because so many countries need fossil fuels so badly, Russia does export manufactured goods to many countries because of its diverse manufacturing base.
Russia’s Trade Balances with European Nations
Next, let us explore some trade balances of Russia with European countries. We start with Finland.
 |
| Fig. 068. Break-up of Russian Exports to Finland by Category, 2020 ($6.81 Bn) |
About $3.6 billion of Russia’s $6.8 billion worth of exports to Finland, or about 53%, is in fossil fuels. Of this, 40%, or $2.73 billion, is through crude oil; 9.5%, or $646 million, is in refined petroleum (diesel/petrol/etc.), and only 1.3%, or $86 million, is from natural gas. Thus, even though natural gas is much discussed in the media, its contribution in monetary terms is not very high. Its contribution in practical value to Finland is very high, as we shall see shortly. Russia’s imports from Finland ($3.46 billion, or only 51% of what Finland imports from Russia) are fairly diverse, which means that Finland is not a monopoly supplier of any item, and Russia can get the items it gets from Finland from other suppliers in case Finland decides not to trade with Russia. Russia is, therefore, at a huge advantage with respect to Finland.
 |
| Fig. 069. Break-up of Exports from Finland to Russia by Category, 2020 ($3.46 Bn) |
A similar story is seen with the Netherlands. Netherlands has plenty of gas from its gas fields in Groeningen, but it has no oil, and so depends heavily on Russia for crude oil and refined petroleum.
 |
| Fig. 070. Break-up of Russian Exports to the Netherlands by Category, 2020 ($22.5 Bn) |
Russia exports $22.5 billion worth of goods to the Netherlands, and receives only $6.5 billion worth of goods in return. Netherlands’ exports are fairly distributed, whereas Russia’s exports comprise largely of $17.5 billion of fossil fuels (78%) and $3.1 billion of metals (14%). If trade with Russia were to be stopped, that’s a huge hole in the Netherlands’ fuels and metals supply.
 |
| Fig. 071. Break-up of Exports from the Netherlands to Russia by Category, 2020 (6.46 Bn) |
Similar stories are seen across Europe. We can look at Poland, for instance. Russia exported $8.7 billion worth of goods to Poland in 2020, of which $6.2 billion, or 71%, was fossil-fuel-related. Metals comprised another $866 million, or 10%, while chemicals comprised $633 million, or 7.3%, of which $218 million was for fertilizers. Thus, three categories — fossil fuels, metals, and chemicals — added up to more than 88% of Poland’s imports from Russia.
 |
| Fig. 072. Break-up of Russian Exports to Poland by Category, 2020 ($8.66 Bn) |
It is worth pointing out that (as will be shown in the next section) although Russia is the dominant supplier of natural gas for Poland, its value in monetary terms is relatively low — a mere $477 million, or 5.5% of Russia’s exports to Poland. As can be seen, Polish exports to Russia in 2020 ($7.6 billion) were very diverse.
 |
| Fig. 073. Break-up of Exports from Poland to Russia by Category, 2020 ($7.63 Bn) |
A similar story plays out in Italy; however, the proportional value of natural gas in Italy’s import mix is much higher.
 |
| Fig. 074. Break-up of Russian Exports to Italy by Category, 2020 ($11.9 Bn) |
As in the case of the other countries discussed earlier, fossil fuels form a very high part of Italy’s imports from Russia, accounting for $9.6 billion out of a total of $11.9 billion, or 81%. However, in Italy’s case, natural gas, too, is monetarily very important, forming 34% of imports at $4.1 billion. Metals are again important, coming to $1.1 billion (9.2%) in Italy’s case and comprising of iron, aluminium, and copper. Italy also imports $532 million worth of platinum and gold from Russia (4.5%). So, these three categories: fossil fuels, metals, and precious metals — add up to nearly 95% of Italy’s total imports from Russia.
 |
| Fig. 075. Break-up of Exports from Italy to Russia by Category, 2020 ($7.71 Bn) |
In contrast, Italy’s exports to Russia are extremely diversified, as can be seen in the tree map. This means that Italy is not a dominant supplier of any good and therefore is not in a strong bargaining position relative to Russia.
No discussion of Europe would be complete without discussing the two European giants, France and Germany — two countries that actually have a trade surplus with Russia. Germany is of particular interest, since it has been in the news for the last nine months because of its extreme reluctance to sanction Russian gas because of how important Russian gas has been to German industry and home heating. Angela Merkel, who was once hailed as a visionary for getting the Nord Stream pipeline and, with it, cheap energy, to Germany, is today being reviled as the cause of Germany’s problems. It is very clear that natural gas is very much the centerpiece of all discussions in Europe. Many other European countries have tried to get Germany to agree to embargo Russian gas, but the Germans have resisted. Of course, now it is irrelevant, because Nord Stream itself has been blown up. Going by all the noise, we would imagine that the monetary value of the natural gas supplied by Russia to Germany is huge, if Europe hopes to punish Russia by denying it this income. Is this really the case? Let us look at Russia’s exports to Germany.
 |
| Fig. 076. Break-up of Russian Exports to Germany by Category, 2020 ($14.2 Bn) |
The map of Russia’s exports to Germany is confusing — where is the natural gas? Actually, it is there, one just has to look very carefully. You may either take my word for it, or go to the OEC website to see exactly where it is. But the value of Russia’s natural gas exports to Germany in 2020 was only $32.1 million, and it formed only 0.26% of Russia’s exports to Germany in 2020. The much bigger piece of the puzzle is oil exports. Crude oil and refined petroleum products made up more than 60% of Russia’s exports to Germany ($8.6 Bn out of a total of $14.2 Bn), and the total fossil fuel bill (including coal) came to $9.72 Bn, which is about 68% of the total exports. Metals made up $1.44 Bn, or 10.1%; precious metals, especially platinum, made up $879 Mn, or 6%. The remaining 15.3% was quite diversified. So the lion’s share of Russia’s exports, as with the other European countries we have seen, is crude and refined oil, with coal being another significant fuel. It is, of course, a bit unbelievable that Russia's gas exports to Germany only amount to $32 million, because it does not square with the data on gas volumes, presented later in this report, whereby Russia supports about 66% of Germany's gas imports, and more gas than it supplies Italy, for instance. So something is not quite correct. Perhaps the amounts are distributed within Europe. There may be an error in OEC's data reporting, but I cannot do anything about it. Nevertheless, the overall import of gas into Europe is about right, at about 4% of Russia's exports, even if the amounts for individual countries may not fully make sense. I have to take the information I have, and this is the best out there.
 |
| Fig. 077. Break-up of Exports from Germany to Russia by Category, 2020 ($26.1 Bn) |
Germany’s exports to Russia totaled $26.1 Bn in 2020, and are quite diversified, as can be seen. Cars and car parts are a big part of those exports, as are packaged medicaments.
France, too, has a trade surplus with Russia. Its overall imports from Russia are much lower than that of Germany, as are its exports to Russia. As with every European country, the lion’s share of Russia’s exports to France are fossil fuels, comprising $4.2 Bn out of a total of $4.93 Bn, or 85.2%. Of this, natural gas contributes to $665 Mn.
 |
| Fig. 078. Break-up of Russian Exports to France by Category, 2020 ($4.93 Bn) |
As with other European countries, France’s exports to Russia are quite diversified.
 |
| Fig. 079. Break-up of Exports from France to Russia by Category, 2020 ($5.97 Bn) |
Finally, let us come to the UK. As noted earlier, the UK had a huge trade deficit with Russia in 2020. Let us see what the trade balance between Russia and the UK looks like.
 |
| Fig. 080. Break-up of Russian Exports to the UK by Category, 2020 ($25.3 Bn) |
We see that $21 Bn of the UK’s $25.3 Bn worth of imports from Russia in 2020, or 83%, were for precious metals, of which $16.9 Bn was for gold and $3.78 Bn was for platinum. As mentioned earlier, too, Russia is a key producer of precious metals. Another $3.54 Bn of the imports, or 14% is in fossil fuels. Essentially, 97% of all Russian exports to the UK fall in these two categories.
Russia’s huge export of precious metals to the UK deserve some explanation. All this gold is not for the internal consumption of the UK. London is home to the London Bullion Market (LBMA), the world’s largest over-the-counter (OTC) market for the trading of gold, silver, and platinum in the world. Much of the precious metal that London receives from Russia is exported to other entities that buy the metal through the exchange, as the following graph of the UK’s exports shows. As can be seen, even though the UK imports $21 Bn worth of gold and platinum from Russia, it exports $27.5 billion worth of gold and platinum.
 |
| Fig. 081. Break-up of UK Exports by Category, 2020 ($371 Bn) |
Therefore, in the case of the UK alone, we need to analyze the trade relationship after removing the precious metal piece from consideration to get a more comprehensive picture. The following is the picture of Russian imports into the UK minus precious metals.
 |
| Fig. 082. Break-up of Russian Exports to the UK by Category, without Fossil Fuels, 2020 ($4.35 Bn) |
Of the $4.35 Bn total exports, fossil fuels and iron ore comprise $3.54 Bn, or 81%. But the precious metal piece is important because in early August, the LBMA banned the sale of bullion from Russia through the LBMA. We now know that this amounts to about $21 Bn. But this ban is largely symbolic, because there are other exchanges where Russia can sell its gold, including in Shanghai. Russia will never have a problem selling its gold. If anything, the move by the LBMA only hurts itself. Since 2015, London has been losing market share in the bullion business to the US and China, and London’s loss will be China’s gain. And it is impossible to track gold by origin, since it can be so easily melted and re-made into bricks.
 |
| Fig. 083. Sale of Gold in International Gold Exchanges |
The UK’s exports to Russia only total $2.84 Bn, and are fairly diversified. Machinery (31%), including prominently gas turbines (4.8%), chemicals (22.7%), including prominently packaged medicaments (7%), transportation (20.1%), including prominently cars (14.5%), and foodstuffs (5.6%), including prominently hard liquor (1.7%), are the dominant exports.
 |
| Fig. 084. Break-up of Exports from the UK to Russia by Category, 2020 ($2.84 Bn) |
Again, as in the case of the other European countries, Russia has far more leverage over the UK than the UK has over Russia. Russia can manage without British cars on its roads, but if the UK needs gold or platinum or hydrocarbons, it would be hard pressed to fill those giant holes in its import basket — $21 Bn in precious metals and $3.54 Bn in fossil fuels. It is futile to say that the UK can do without these commodities — if it did not need them, it would not be importing them.
Replacing Europe’s Exports to Russia
From the preceding, it is clear that Russia has a huge advantage over Europe, because what Russia provides to Europe cannot be easily replaced, whereas what Europe provides Russia can be easily replaced. We have already seen that China supplies Russia with more than $50 billion worth of goods annually. That is probably more than the combined exports of Europe to China (I have not added them up.) If Europe blocks Russia from receiving its products over Russia’s invasion of Ukraine, China can easily double its production of goods to sell to Russia. One of the key motivations of the Belt and Road Initiative for China was to develop its West and South. The idea was to build transportation corridors to the rest of Asia and Africa so that goods produced by factories in Xinjiang could be sold in Asian and African markets with as little transportation cost as possible. But if Europe’s embargo on Russia continues, China could achieve the same goal without the expense of building the BRI, because Russia is just across the border from Xinjiang and Tibet. An annual requirement of another $50 billion from Russia would give a tremendous boost to the Chinese economy and probably help it achieve its goal of the highest GDP-per capita in the world much faster. It would have almost a captive economy in Russia with zero competition from the West. Its only competition for goods exports to Russia would be other Asian developing countries, such as India, Malaysia, and Vietnam, who too have refused to join the embargo against Russia. India has steadfastly refused to rule out buying Russian goods (and we have seen the reason earlier in this article). Malaysia’s foreign minister has clearly said that unless sanctions are authorized by the UN, it will not follow them. Likewise, Indonesian President Joko Widodo has also said that his country has no plans to join sanctions against Russia.
In 2020, Vietnam exported $3.15 Bn, India $2.87 Bn, and Malaysia nearly $1 Bn to Russia. If demand from Russia picks up, economic activity in all these three developing economies would speed up dramatically.
 |
| Fig. 085. Break-up of Malaysian Exports to Russia by Category, 2020 ($959 Mn) |
 |
| Fig. 086. Break-up of Vietnamese Exports to Russia by Category, 2020 ($3.15 Bn) |
 |
| Fig. 087. Break-up of Indian Exports to Russia by Category, 2020 ($2.87 Bn) |
If Russia needs $50 Bn of goods to replace the imports it was previously receiving every year from Europe, it can only get them from Asia, and one cannot imagine the tremendous resulting boost in manufacturing this shift would give these Asian economies and, indeed, all the economies of Asia. Western sanctions could be a boon for Asia, without affecting Russia very significantly.
But Europe has no easy way to replace what it is getting today from Russia. In particular, there is no easy way to fill the huge hole caused by the absence of Russian fossil fuels from European markets. The energy crisis facing Europe, as we shall see in the next chapter, is primarily a supply crisis.
We come back to the two questions we asked early in this chapter:
- Can a complete embargo on Russian sales of its commodities be imposed?
- If a complete Western embargo could be imposed on Russia’s energy sales, could Russia survive?
The answer to the first question is clearly no. Russia has plenty of customers who want the things it sells, be those fuels, gold, diamonds, wheat, metals, chemicals, or manufactured goods. Russia is too important a player in the world to be effectively embargoed.
The answer to the second question is clearly yes, because Europe only buys 24% of Russia’s exports (in the form of energy). If they stopped buying that energy and Russia had no other place to sell it, they will lose 24% of their export revenue. However, given how much China needs Russian oil, and how much the rapidly developing economies of Asia need oil, Russia will be able to sell most, if not all the oil it was selling to Europe. Gas is a trickier proposition, because it requires pipelines. However, only 6% of Russia’s exports (by monetary value) to Europe consisted of gas. This is hardly going to be a huge loss for Russia. They will probably flare (burn) it if they cannot sell it. As we will see in the next chapter, gas is far more valuable to Europe than it is to Russia.
In the next chapter, we will explore the energy piece in detail and show how the absence of Russian energy will likely deal a death blow to European economies.
Key Takeaways from Chapter III
- Russia’s exports have grown at an annual CAGR of 4%, higher than any European country
-
Apart from fossil fuels, which forms 50% of exports, Russia exports a wide variety of goods, including precious metals, chemicals, agricultural products, machinery, wood products, foodstuffs, and plastics and rubbers
- This makes Russia an indispensable trade partner for much of the world
-
Russia has very significant trade surpluses with the world as a whole
- It has significant trade surpluses with many European nations
- It has giant trade surpluses with African nations
- With the exception of China, Russia has huge trade surpluses with all Asian nations
- Because of this, Asian and African countries will not sanction Russia
-
China is a major trading partner for Russia
- China comprises 35.5% of Russia’s total exports to Asia and 54.2% of its imports from Asia
- China supplies more than $50 billion worth of goods to Russia
- China can replace all the goods that Russia was importing from Europe
- Russia can replace exports of oil to Europe with exports to China
- China needs Russian oil to develop its West and South
-
The West’s total imports of oil, gas, and coal from Russia form only 24% of Russia’s exports
- Gas imports by Europe amount to only 4% of Russia’s exports
- Europe’s embargoes on Russian energy do not cripple Russia’s economy
-
In contrast, fossil fuels are a huge percentage of the import bill of European countries from Russia, amounting to as much as 80%
- Essentially, Europe needs to buy Russian fossil fuels a lot more than Russia needs to sell them to Europe
- Europe refusing to sell its goods to Russia can be a boon for the economies of Asia, as their production capacities increase to supply Russia’s needs
- Russian gas helped Europe reduce its dependence on fossil fuels and move into renewables, and by sanctioning Russian energy, Europe is taking a huge step backward
CHAPTER IV. EUROPE’S ENERGY DEPENDENCE ON RUSSIA
Russian Fossil Fuels Do Not Cost Europe Much
In the previous chapter, we saw some numbers on how much European countries were spending on importing hydrocarbons from Russia. Poland imported $6.2 billion worth of fossil fuels; Italy, $11.9 billion; Germany, $9.72 billion; France, $4.2 billion; and the UK, $3.54 billion. While these numbers look large, they are really not very significant as percentages of these countries’ total imports. To see this, let us look at some distribution of countries’ imports by destination.
 |
| Fig. 088. Poland's Total Imports, by Country of Origin, 2020 (Total: $269 Bn) |
 |
| Fig. 089. Italy's Total Imports, by Country of Origin, 2020 ($429 Bn) |
 |
| Fig. 090. Germany's Total Imports, by Country of Origin, 2020 ($1.1 Tn) |
 |
| Fig. 091. France's Total Imports, by Country of Origin, 2020 ($562 Bn) |
 |
| Fig. 092. The UK's Total Imports, by Country of Origin, 2020 ($610 Bn) |
As can be seen, total imports from Russia form only 3.2%, 2.8%, 1.3%, 0.9%, and 4.2% of the import budgets of Poland, Italy, Germany, France, and the UK, respectively; and fossil fuels form between 50%-80% of that small percentage. Yet, they play an outsized role in determining the health of these economies. The much talked-about gas imports are even more miniscule: for Poland, the value of gas from Russia is less than 0.2% of Poland’s total imports; for Italy, just under 1%; for Germany, 0.003%; for France, 0.012%, and for the UK, 0.06%. Yet, the media is full of reports about how the lack of natural gas is going to force Europe to ration gas this winter, and about how businesses are closing down because of the gas crisis in Europe.
What this tells us is that fossil fuels play a role in the economies of European countries that is disproportionate to their monetary value. This is why sanctions are misplaced, because they are focused on the monetary value. As has already been explained in the previous part, the total fossil fuel exports that can be affected even if Europe bans the import of all oil, gas, and coal from Russia will not amount to even a quarter of Russia’s exports. Let us understand in this chapter how something that is not financially so important ends up being so important in determining the economic fates of European economies.
In particular, what needs to be understood, and what will hopefully be clear after reading this part, is that Europe’s problem is not a financial one. It is not the increase in price of gas or oil that is going to hurt Europe. Europe can afford that. Take Germany, for example. Its total imports amounted to $1.1 trillion in 2020. Gas only came to 0.003%, or $33 million. Even if the cost of gas went up 20 times, that would only be $660 million, or still only 0.06% of Germany’s imports. It is a miniscule amount for the German government. It is not miniscule for companies, because their profits are greatly impacted by such changes in price. But the government could easily keep companies afloat by bailing them out for the high prices.
For nine months, the Western media has been parroting the same false information: that sanctions are necessary to stop Russian gas sales to Europe, so that “Russia's ability to wage war” is degraded. Germany, in particular, has been the cynosure of all eyes, because of its heavy dependence on Russian gas. Yet, what we see here is that Germany's imports of gas from Russia only amounted to 0.26% of its total imports from Russia — only around $37 million out of a $14.2 billion import bill. Essentially, Europe's entire Russia strategy in the wake of the Ukraine conflict has been based on a red herring.
So Europe’s problem is not a financial problem; it is a supply problem. Europe’s problem is that it needs energy, the energy that it has banned from Russia, and that it has no way in the short term (1-2 years) of getting from anywhere else. And that neither its people nor its industry can do without that energy for 1-2 years.
Europe’s Energy Needs and Sources
Europe’s Gross Available Energy (GAE), which is the total energy that the continent uses, across all the countries of Europe and across all sources, amounted to 62,847 PetaJoules (PJ) in 2019 and 57,743 PJ in 2020 (One Petajoule is 1000 trillion Joules; a Joule is the basic international unit of energy. A million Joules is around 0.28 kWh, and 1000 Joules is about 0.95 BTU, or British Thermal Units). The year 2020 was a year of lower demand than usual because of the Covid pandemic, yet the division between the different sources of Europe’s energy was roughly the same, as can be seen from the two charts below that show the breakup of this energy supply in 2019 and in 2020. Hence, moving forward, I will mostly talk about the 2020 numbers, unless the numbers for 2020 are not available, in which case I will discuss the 2019 numbers.
2019:
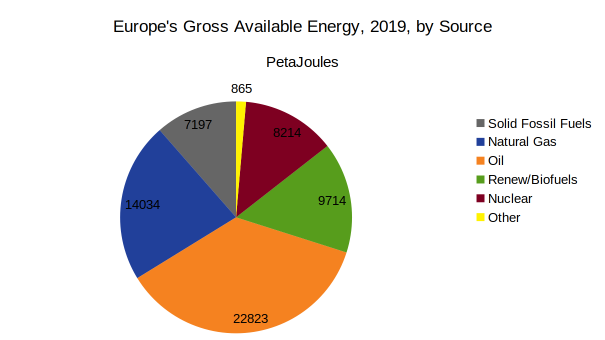 |
| Fig. 093. Break-up of Europe's Total Energy Use by Energy Source, 2019 (Petajoules) |
 |
| Fig. 094. Break-up of Europe's Total Energy Use by Energy Source, 2020 (Petajoules) |
This can be understood in percentage terms in the next figure.
 |
| Fig. 095. Break-up of Europe's Total Energy Use by Energy Source, 2020 (Percentages) |
Essentially, 32% of the energy that Europe uses is obtained from oil, 22% from natural gas, 16% from renewables, 12% from nuclear energy, 9% from solid fossil fuels (coal, etc.), and 1% from other sources. However, Petajoules are not a very useful measure for most people to understand, so let me explain what this means in practical terms for the most common sources. One billion cubic metres (bcm) of natural gas, the standard unit of measurement of gas, equals 37.68 petajoules of energy. Likewise, one petajoule of energy equals 0.16 million barrels of oil equivalent of energy. And one petajoule of energy is equal to 34,121 tons of coal equivalent. Using these, we can understand Europe’s 2020 energy needs to be 3,187 million barrels of oil, 363 bcm of natural gas, and 200 million tons of coal.
However, at this point I need to caution the reader that there is considerable variation in these numbers when looking even at official EU sources. For example, in contrast to the figures above, which gives the total gross available energy for the EU in 2020 to be 363 bcm of natural gas, another official EU source, the Fourth Quarterly Report on European Gas Markets, 2020, gives that same number to be 394 bcm of natural gas. After many attempts to reconcile these contradictory figures, I have decided to go with one source, keeping in mind that what is important are the broad orders of magnitude of the problem and the broad partitioning of the energy needs of the continent and its countries. There can be small variations (this is just a difference of less than 8%) in the totals, but the percentages (such as how much is imported, and from which countries) are reasonably close.
Of the 57,743 PJ that Europe required in 2020, it only produced 24,027 PJ, leaving it with a shortfall of 33,716 PJ, or 58% of its total energy needs. This needed to be imported. The next figure shows how this production of energy is subdivided.
 |
| Fig. 096. Break-up of Europe's Energy Production, by Energy Source, 2020 (Petajoules) |
Again, using the equivalents explained above, it can be seen that Europe produces 142 million barrels of oil, 46 bcm of natural gas, and 120 million tons of coal. It is clear that most of Europe’s energy production comes from renewables (41%), followed by nuclear energy (31%), and solid fossil fuels (15%). About 7% comes from natural gas and 4% comes from oil.
From these, we can find out the energy deficit that Europe faces on an annual basis. In 2020, as we already know, the total shortfall in energy was 33,716 PJ. The next figure shows how this shortfall is partitioned. Only coal, natural gas, and oil are shown, because there is hardly any shortfall in renewables and nuclear power. It is important to show the energy deficit in this manner because, for instance, a utility boiler that has been designed to run on coal cannot be trivially modified to use natural gas; or a chemical plant that uses an oil fired furnace cannot be trivially modified to use natural gas.
 |
| Fig. 097. Europe's Energy Shortfall, 2020 (Petajoules) |
As before, we can convert the PJ units into quantities that are easier to understand. Europe’s energy shortfall in 2020 amounted to 3,044 million barrels of oil, 315 bcm of gas, and 81 million tons of coal.
The next figure shows how this looks like on a percentage basis. What this graph tell us is: of Europe’s installed plants, how much coal, natural gas, and crude oil is needed as a percentage of the total demand?
 |
| Fig. 098. Europe's Energy Shortfall in Percentage Terms by Energy Source, 2020 |
This graph is very instructive. Essentially, in 2020, Europe needed to import 40% of its total coal requirement, 87% of its total natural gas requirement, and 96% of its total oil requirement. Even if there are slight errors in the data reporting on the EU websites, or slight variations from year to year, the broad trends are unmistakable. Europe is heavily dependent on imports for its energy needs.
The next figure shows how dependent many individual countries in Europe are on energy imports for their energy requirements. Most countries in this list import between 40-80% of their total energy needs.
 |
| Fig. 099. Energy Import Dependency of Various European Countries, 2020 |
These are massive energy dependencies. Let us now see where Europe gets these fuels from. On a gross level, as the Eurostat website reports (emphasis mine)
In 2020, almost three quarters of the extra-EU crude oil imports came from Russia (29 %), the United States (9 %), Norway (8 %), Saudi Arabia and the United Kingdom (both 7 %) as well as Kazakhstan and Nigeria (both 6 %). A similar analysis shows that over three quarters of the EU's imports of natural gas came from Russia (43 %), Norway (21 %), Algeria (8 %) and Qatar (5 %), while more than half of solid fossil fuel (mostly coal) imports originated from Russia (54 %), followed by the United States (16 %) and Australia (14 %).
So Europe is hugely dependent on Russia for its energy needs. From the previous data presented, it follows that Europe imports 5,519 PJ of oil (about 883 million barrels, or 2.4 million barrels/day), 5,145 PJ of natural gas (about 135 billion cubic metres of natural gas), and 1,278 PJ of coal (43.6 million tons equivalent) from Russia every year. (Again, the other EU source mentioned earlier, viz., the Fourth Quarterly Report on European Gas Markets, 2020, gives a slightly higher dependence on Russia – to the extent of 156 bcm of gas. But I am sticking to one source in order to be consistent. These values are close enough for the discussion in this article. In fact, as will be clear, I am being conservative by taking the lower dependence on Russia for my analysis.)
This means that Europe, as a whole, currently imports 27.7% of its total oil requirement, 37.6% of its total gas requirement, and 21.8% of its total coal requirement from Russia.
This is shown in the graph below.
 |
| Fig. 100. Europe's Requirement for Energy Imports from Russia, by Energy Source, 2020 |
Currently, Europe is getting no gas from Russia. It is also proposing to have an oil price cap on Russian oil, to which Russia has responded by saying that if such an oil price cap (which is due to come into force on December 5, 2022) is agreed to by any country, Russia will simply stop supplying oil to that country. In light of what we learned in the previous part, viz., that oil only constitutes 20% of Russia’s total exports, we can understand that this is not a bluff. Russia will take a hit, but it can survive with a 20% reduction in exports. In addition, on August 10, 2022, the EU agreed to a total embargo on Russian coal. Given that Europe is moving towards a total ban on Russian fossil energy, where might they get the energy from? Who are the global suppliers of these fossil fuels?
Back to TOC
The Global Gas Market and Europe’s Needs
Gas is what much of Europe’s industry runs on. It is also what much of its electricity infrastructure and domestic heating runs on. Some numbers will help the reader understand the scale of the problem. As already discussed, Europe’s gas shortfall is of the order of 135 bcm.
The global production of natural gas in 2020 was around 4000 bcm (billion cubic metres) of gas, and Russia’s production was 722 bcm of that, or nearly 18%. More important than the total production of natural gas is the total export volume of natural gas, because many countries consume much of the gas they produce. The figure below shows the exports of natural gas by country in 2020, which total to 1203 bcm. Russia is the largest exporter of natural gas, at nearly 17% of world total, exporting 200 bcm of gas annually. They are followed by the USA (150 bcm, 12.4%), Qatar (144 bcm, 11.9%), Norway (113 bcm, 9.4%), Australia (102 bcm, 8.5%), and Canada (71 bcm, 5.9%). Germany appears as one of the top exporters in the chart, but that is deceptive, because Germany’s exports are internal European rearrangements of Russian gas.
 |
| Fig. 101. Top Gas Exporters in the World |
As previously mentioned, Europe’s annual needs of natural gas, based on 2020 figures, are about 315 bcm, of which it gets 135 bcm (43%) from Russia. Needless to say, these are representative figures, and change from year to year. However, the percentages are roughly in this region, and give an idea of the energy dependence, even if the actual numbers may vary (from 43% to 48%, for example). The total actual demand of natural gas may also vary from year to year, but will probably be in the 300-400 bcm range.
So Europe’s gas imports from Russia amount to about 11 % of the total global exports of natural gas. This gas has now vanished from Europe. If Europe has to power its industry and keep its people warm, it will need to get this 135 bcm, or 11% of the world’s natural gas exports, from other places. Unfortunately for them, most of the natural gas production in the world is already booked, because gas cannot be stored near the well beyond a certain amount, because it is so voluminous. All the natural gas that is extracted in the world today is already committed to existing customers. The only way to get more natural gas than what has been already committed to other countries is to drill new wells. That takes time, and if Europe wants more gas from gas producing countries, it also means that Europe will have to commit to buying this gas from the producer for a long time, say for 20 years, much as it did with Russia and Nord Stream, so that the cost of drilling these wells can be recovered.
Even if some of this gas requirement could be obtained, the problem with natural gas is that there are only two ways to get natural gas from a supplier. One is to transport it by pipeline and the other is to compress it into liquefied natural gas and ship it. Europe has no major pipelines supplying gas except for: the Nord Stream pipelines that were flowing under the North Sea; the Yamal pipeline, which flowed through Belarus; the old Brotherhood pipeline, which flowed through Ukraine and was built during Soviet times; and the Turkstream pipeline, which carries gas from Russia to Europe through Turkey. The flows through all four pipelines has now stopped. The Nord Stream pipeline flows were stopped by Russia on technical grounds in late September 2022. Subsequently, the Nord Stream pipelines were blown up, ostensibly by Western submarines, as already discussed. In April 2022, the flow of gas through the Yamal pipeline was stopped by Russia because Poland and Bulgaria refused to comply with Gazprom’s demand that payment for gas be made in rubles, since Western countries had made it impossible for Russia to exchange their dollars and euros. In May 2022, Ukraine closed down the Brotherhood pipeline because the war made it impossible for them to control it. The Turkstream pipeline transports Russian gas to Turkey from below the Black Sea, and onwards to Bulgaria. However, in April 2022, Bulgaria refused, like Poland before it, to pay Russia in rubles, and so flows to Bulgaria from Turkey through Turkstream were stopped.
 |
| Fig. 102. The Gas Pipelines from Russia to Europe |
Thus, Europe currently receives no gas from Russia from the various pipelines connecting Russia with Europe, and which have been constructed after investing billions of dollars. Europe also does not have enough LNG terminals to receive liquefied natural gas and enough infrastructure to decompress natural gas and transport it internally via pipelines if it tries to import LNG from the US, Canada, the UAE, or Qatar. These have to be built, and it will take several months to years to get them ready (discussed later in this article); and even when they are ready, the world does not have enough extra LNG to power all of Europe. So Europe has a serious supply problem for the coming winter.
To the extent that Europe can manage to get some gas to bridge the shortfall in supply, they are going to pay through their noses, because the shortage of gas in the Western world is going to push up prices, as it already has. The total gas import bill for Europe in 2020 was € 36.5 billion, down from € 59.4 billion in 2019. This gives us an order of magnitude idea of how much the annual import bill from gas for Europe has been. 2020 was actually not a good representative year, because Covid reduced demand worldwide. Given that Russia accounts for roughly half of Europe’s gas imports, that means that, on average, in a year, Europe spends about € 25 billion in gas payments to Russia (these figures are derived from the Eurostat data. The data from the OEC website, used earlier, give somewhat different figures, but are in the same ballpark). In contrast, in the seven months since this war began, Europe already spent more than € 46 billion on gas payments to Russia alone because of skyrocketing gas prices.
The Global Oil Market and Europe’s Needs
The oil picture is not very different from the gas picture. The figure below shows (data from the US Energy Information Adminstration) the top crude oil exporters in the world in terms of the percentage of total oil exported in 2018 (The data for the US and Canada is updated to 2020 because it was available). The list is topped by the Kingdom of Saudi Arabia (KSA) at 15.4% (375 million tons out of 2,439 Mtons/y), followed by Russia at 10.9% (266 Mtons/y), Iraq at 8.3% (203 Mtons/y), US at 6.7% (162 Mtons/y), Canada at 6.3% (154 Mtons/y), UAE at 5.1% (124 Mtons/y), Iran at 4.7% (114 Mtons/y), Nigeria at 4.0% (97 Mtons/y), Kuwait at 3.8% (94 Mtons/y), and Kazakhstan at 3.2% (78 Mtons/y) to round off the top 10.
 |
| Fig. 103. Top World Exporters of Crude Oil, Percentages of Total, 2018 |
 |
| Fig. 104. Top World Exporters of Crude Oil, Percentages, 2018 |
 |
| Fig. 105. Top World Exporters of Crude Oil, Million Tons Per Year, 2018 |
As explained previously, Europe imported around 883 million barrels of oil (124 million tons) a year from Russia in 2020. Assuming that the data for 2018 exports of oil is not too different from that in 2020 (the US and Canada data, have been updated, and these are the most important figures that need updating, because of the exploration of shale oil in the US), that would amount to 5.1% of total world output. This oil will vanish from Europe on December 5, 2022 when Europe announces its oil price cap on Russia. So Europe will have to find some way to fill this giant hole in its crude oil supply. Europe will have to get the rest of the world to supply it an extra 124 million tons of oil a year, or an extra 0.34 million tons of oil (2.4 million barrels) every day from the remaining producers of crude oil who currently extract 5.5 million tons of oil (39 million barrels) every day, because Europe will not do business with Russia. That’s asking for an extra 6.2% production in crude oil output. That’s practically impossible. The most that a country like Saudi Arabia can do is increase production by about half a million barrels a day. And Saudi Arabia is the biggest producer of oil. Asking for 2.4 million barrels a day is an impossible request. European industry and oil-based power utilities will have to shut down. There simply isn’t that much spare crude oil capacity lying around in the world. It can be explored and pumped in some time, but not in time for this winter, and probaby not even in time for next winter. Indeed, as the annual production of crude oil figures show, over a long time, the long-term average growth of crude oil production is about 0.64 million barrels/day per year. The reasons for this are the same as the reasons why gas production cannot be suddenly increased: once an oil well is dug, it keeps releasing oil, and someone must be willing to buy it. So oil companies like to have long-term customers. In light of Europe making pledges to wean itself off fossil fuels, this is not what Europe is looking for. Yet, without that kind of commitment, nobody will dig new wells to get more oil for Europe. And even if such long-term deals are agreed to, it will take at least a year for the new wells to be dug and become operational. Europe will likely have to manage without its oil for this winter and probably the next winter.
 |
| Fig. 106. Increase in Annual Global Exports of Crude Oil, 1980-2018 |
A similar picture is seen when one looks at total crude oil production, not exports, which is not surprising. The average annual increase is 0.71 million barrels a year.
 |
| Fig. 107. Increase in Annual Global Production of Crude Oil, 1980-2020 |
What will Europe do without oil? EU countries have emergency oil stocks to use in case of emergencies. In July 2022, these amounted to about 103.6 million tons of oil, which at the rate of 1.15 million tons a day will sustain Europe for 90 days, or three months. Europe also keeps track of commercial oil stocks. Again, in July 2022, these amounted to 51.4 million tons, which again, at the burn rate of 1.15 million tons a day, will last Europe for 45 days. If the conflict with Russia lasts much longer than that, what can Europe do for oil after that?
The chart below shows the number of days that the emergency stocks for each country will last it. As of July 2022, ten countries did not even have 3 months emergency stocks. With no oil supply from Russia and no one else to supply it, how will Europe survive?
 |
| Fig. 108. Emergency Stocks of Crude Oil in Different European Countries, July 2022 |
The US tried to persuade the Kingdom of Saudi Arabia to increase production of crude to help with the crisis. However, on October 5, 2022, OPEC+ took a decision to reduce production by up to 2 million barrels a day, keeping in mind the slowing global economy, despite US pressure. Far from increasing output by 2.4 million barrels a day, OPEC+ has decided to reduce output.
In addition, the oil shale boom in the US is coming to an end, which makes it unlikely that US shale producers can fill Europe's giant oil gap.
This means that there is simply no way for Europe to fill the giant hole caused by Russia’s oil vanishing from Europe in case Russia refuses to sell oil to Europe if Europe decides to go ahead with an oil price cap.
The Global Coal Market and Europe’s Needs
The charts below show the top coal exporters in 2020, both in terms of total tonnage and percentages. In 2020, the total global production of coal was 1,329 million metric tons, or 1,487 million short tons. Of this, Indonesia is the world leader at 410 million metric tons, followed by Australia at 390 million metric tons, and Russia in third place with 222 million metric tons.
 |
| Fig. 109. Top World Coal Exporters, Million Metric Tons, 2020 |
 |
| Fig. 110. Top World Coal Exporters, Percentages, 2020 |
As discussed before, Europe imports 43.6 million metric tons of coal from Russia. That is a small percentage (3.2%) of the global total coal supply of 1,349 million tons. The low need for coal in Europe is because of the conscious shift away from coal in the past 30 years in the quest for greener sources of energy. This is not particularly problematic to replace with other sources such as Australia. So we need to mainly concern ourselves with oil and gas in further discussions.
However, there is one situation in which the above considerations become important. If Europe finds that it cannot get any natural gas or oil for its heating and industry needs, and wants to go back to coal out of desperation, then it will need an extra 364 million tons of coal to completely switch from both oil and natural gas to coal. That would amount to nearly 27% of current global exports of coal. Since Russian coal has to be excluded because of the sanctions, that would actually amount to 32% of the remaining global coal supply. Of course, Europe would not need to import all of that coal – it could re-open its coal mines. As a previous graph showed, coal production in Europe in 1990 was 277 million tons, and has come down to 57 million tons today. If Europe were to go back to those levels, the import requirement might come down by 200 million tons, but Europe would still need 164 million tons out of a total of 1127 million tons, which is nearly 15% of current exports. Not only will getting 15% more coal take time, but it will also take time to re-open the old mines in Europe to unlock those 200 million tonnes.
Two things need to be mentioned about the above paragraph. One, this scenario is an extreme one, because Europe has been committed to green energy over the last 20 years, as exemplified even in their recent COP27 addresses, so they would be loath to go back to dirty, polluting coal. But pollution is better than death, and in extreme situations, you resort to extreme measures.
Two, it is far from trivial to go back to using coal when you have been using natural gas or oil. All your furnaces need to be re-engineered to accept coal. There are significant engineering challenges in using coal, such as slag formation, flyash, and significant pollution, both from particulate solids as well as from sulfur and nitrogen oxides. So it is not an overnight switch and will take years. As a result, none of these solutions is workable in the short term.
What we have learned from the discussion in the last three sections is that Europe’s shortfalls in natural gas and oil that are going to be caused by their unilateral boycott of Russian gas and oil cannot be bridged with the remaining (i.e., excluding the Russian supply) available global supply of natural gas and oil; and if, faced with this predicament, Europe tries to switch from oil and gas to coal, there will not be enough coal for their needs from the available global supply of coal, either.
Having understood that Europe’s fossil fuel deficits cannot be bridged by the available supply of fossil fuels in the world, let us look at what this means for individual countries in Europe. What deficits in fossil fuels do individual countries in Europe face, and what might this mean for them? This is considered in detail in the following sections.
Individual Country Profiles
Germany
The International Energy Agency gives us statistics on energy usage for various countries. Let us look at the distribution of energy sources for Germany in the following figure. Germany uses 11.6 exajoules annually (1 exajoule = 1 billion billion joules), of which 34% comes from oil, 27% comes from natural gas, 16% from coal, 11% from biofuels and waste, 6% from renewables such as wind and solar, 6% from nuclear energy, and 1% from hydro power.
 |
| Fig. 111. Break-up of Germany's Energy Usage by Energy Source, 2020 |
In terms of actual numbers, Germany needed 61.8 million tons of coal, 82.8 bcm of natural gas, and 632.7 million barrels of oil (or 88.6 million tons of oil) in 2020. Let us see how much of those requirements was imported. The picture of Germany’s natural gas imports is seen below. Germany imports a total of 79 bcm of natural gas, or almost its entire requirement, and 52 bcm of that, or 66.1% (which is 39% of all of Europe’s natural gas imports from Russia) is imported from Russia, as the map below shows. Now Germany has to make up that shortfall from other sources. Thus, Germany imports 62.8% of its total natural gas needs from Russia.
 |
| Fig. 112. Germany's Imports of Natural Gas by Origin Country, 2020 |
 |
| Fig. 113. Germany's Imports of Oil and Petroleum Products by Origin Country, 2020 |
Although Germany only needed 88.6 Mtons (million tons) of oil in 2020, it imported 117.5 million tons (a good part of which was re-rexported to other countries). Of this 133 million tons, Germany imported 29.7% of its oil and petroleum product needs from Russia, which amounts to 34.9 Mt (million tons) of oil. That amounts to 44% of Germany’s annual need for oil, and about 8.3% of Europe’s total import of oil from Russia.
As mentioned above, a good portion of Germany’s imports ended up being exported to other countries in Europe, to the tune of 22.3 million tons, as can be seen below.
 |
| Fig. 114. Germany's Exports of Oil and Petroleum Products by Destination Country, 2020 |
Of its 61.8 Mtons of coal requirement, Germany imported 31 Mtons of coal in 2020. Of that, it imported 46% from Russia, or about 14.3 Mt of coal. That amounts to 23% of Germany’s annual needs, and a third of Europe’s total annual import of coal from Russia.
 |
| Fig. 115. Germany's Imports of Coal by Origin Country, 2020 |
In summary, Germany is heavily dependent on Russia on all three fuels, which probably explains its extreme reluctance to go along with sanctions against Russia. It imports 62.8% of its natural gas needs, 44% of its crude oil needs, and 23% of its coal from Russia. These shortfalls will be impossible to fill.
Poland
The figure below shows the total energy usage for Poland, as reported by the IEA. Of the total energy needs of 4,054 PJ in 2020, 41% came from coal, 18% from natural gas, and 30% from oil. In actual numbers, Poland used 56.9 Mtons of coal, 19 bcm of gas, and 27.2 Mtons of oil.
 |
| Fig. 116. Break-up of Poland's Energy Usage by Energy Source, 2020 |
In 2020, Poland imported 17.4 bcm of natural gas. Of that it got 75.4% from Russia — 54.8% directly from Russia and 20.6% via backflows from Germany. In effect, it got 13.1 bcm from Russia (that’s 9.7% of Europe’s total imports of natural gas from Russia). That means that Poland got 68.9% of its annual natural gas from Russia.
 |
| Fig. 117. Poland's Imports of Natural Gas by Origin Country, 2020 |
 |
| Fig. 118. Poland's Imports of Oil and Petroleum Products by Origin Country, 2020 |
Poland also imported 32.9 Mtons of oil and petroleum products; 67.5% of that, or 22.2 Mt of oil, from Russia (that’s 5.2% of Europe’s total oil and petroleum products imports from Russia). That amounts to 81.6% of Poland’s total annual oil needs. Poland has imported more than it needs,because it has exported some of that oil to other countries. The graph below shows Poland’s oil exports to other countries, which amounted to 4.81 Mtons in 2020.
 |
| Fig. 119. Poland's Exports of Oil and Petroleum Products by Destination Country, 2020 |
Poland also imported 15.1 Mt of coal; and 63% of that, or 9.5 Mt, from Russia in 2019 (2020 figures not available). Assuming these numbers are not very different in 2020, that amounts to 22% of Europe’s total coal imports from Russia. It also amounts to 16.7% of its annual coal needs. (Among all European nations, Poland is the one that has taken the slowest time to transition from coal. The Polish government estimated that it might take it until 2049 to completely wean itself away from coal.)
 |
| Fig. 120. Poland's Imports of Coal by Origin Country, 2019 |
So, as can be seen, Poland imports 68.9% of its total natural gas, 81.6% of its oil and refined petroleum, and 16.7% of its total coal from Russia. Yet, they have been the most vocal proponents for sanctions against Russian energy. Nobody in Poland seems to have asked what Poland would do without Russian energy.
The United Kingdom
The figure below shows the partition of the total energy needs of the United Kingdom for the year 2020. Of its total energy consumption of 6,487 PJ, only 3% (7.5 Mtons) came from coal; 41% (70.9 bcm) came from natural gas; and 32% (46.3 Mtons) came from oil.
 |
| Fig. 121. Break-up of the UK's Energy Usage by Energy Source, 2020 |
The United Kingdom has been quite aggressive in asking for energy imports from Russia to be banned, and a look at their import dependence tells us why. They are not terribly dependent on Russia, with less than 7% of their natural gas imports coming from Russia (around 3.2 bcm in 2019). This amounts to just 4.5% of their annual natural gas needs. Most of their natural gas imports come from Norway, and they also produce their own natural gas in Scotland. It was therefore easy for the UK to demand sanctions against Russia.
 |
| Fig. 122. The UK's Imports of Natural Gas by Origin Country, 2019 |
A similar story is seen in oil and coal. The UK only imports 12.2% of its oil and petroleum product imports, or 10.4 Mt (22.5% of its total annual needs), from Russia. This comes to 22.5% of its total oil needs.
 |
| Fig. 123. The UK's Imports of Oil and Petroleum Products by Origin Country, 2019 |
The UK also exported 65.4 Mt of oil and petroleum products to a variety of countries. Keep in mind that this represents oil and petroleum products, so it combines both crude oil and its distillates such as diesel, gasoline, and aviation fuel. So the UK might be importing crude from Russia and exporting diesel to China.
 |
| Fig. 124. The UK's Exports of Oil and Petroleum Products by Destination Country, 2019 |
The UK does import a third of its coal imports from Russia (2.5 Mt, or a third of the UK’s annual coal needs), but given that its dependence on coal is so low (just 3% of total energy needs), this is not too significant.
 |
| Fig. 125. The UK's Imports of Coal by Origin Country, 2019 |
Overall, the UK imported 4.5% of its annual gas needs, 22.5% of its annual oil needs, and 33% of its annual coal needs from Russia.
Italy
Italy’s annual energy requirement, as of 2020, was 5,661 PJ. Of that, Italy needed 6.8 Mtons of coal (4% of total energy), 65 bcm of natural gas (43%), and 41.3 Mtons of oil (33% of total energy).
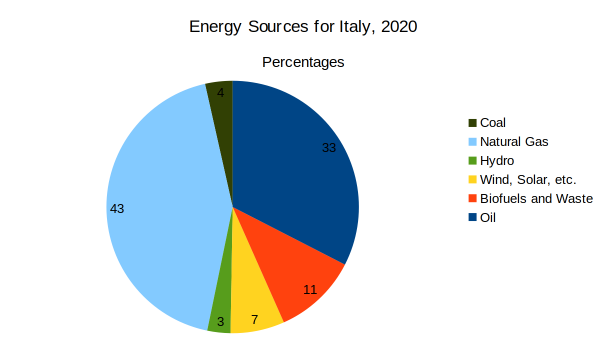 |
| Fig. 126. Break-up of Italy's Energy Usage by Energy Source, 2020 |
Italy imported 66.7 bcm of natural gas in 2020. Of that, more than 43%, or 28.7 bcm came from Russia (and that is 21% of Europe’s natural imports from Russia). This is 44% of Italy’s annual natural gas needs as of 2020. Fortunately, because of their proximity to Africa, Italy also gets Algerian, Norwegian , Libyan, American, and Qatari gas (through LNG), but 44% is a big number that is impossible to compensate for.
 |
| Fig. 127. Italy's Imports of Natural Gas by Origin Country, 2020 |
Italy also imported 65.4 Mt of oil and petroleum products in 2020, and 12.5% of that, or 8.2 Mt, from Russia. This amounted to 19% of Italy’s total oil and petroleum products need for 2020.
 |
| Fig. 128. Italy's Imports of Oil and Petroleum Products by Origin Country, 2020 |
Italy imported 7.6 Mt of coal in 2020, and 52.7% of that, or 4 Mt, was from Russia. This amounted to 58.8% of its total needs of coal for 2020.
 |
| Fig. 129. Italy's Imports of Coal by Origin Country, 2020 |
In summary, Italy imported 44% of its natural gas, 19% of its oil, and 59% of its coal from Russia in 2020. Sanctions on Russia, therefore, will have a significant deleterious effect on its economy.
France
France needed a total of 9.280 Petajoules of energy in 2020. Of this, 228 PJ. or 2%, came from coal (7.8 Mt of coal); 2,582 PJ, or 28%, came from oil (57.8 Mt of oil); and 1,464 PJ, or 16% came from natural gas (38.8 bcm).
 |
| Fig. 130. Break-up of France's Energy Usage by Energy Source, 2020 |
France imported 46.4 bcm of natural gas in 2020; of this, 16.9%, or 7.8 bcm of gas, came from Russia. This amounted to 20.2% of France 2020 natural gas requirement.
 |
| Fig. 131. France's Imports of Natural Gas by Origin Country, 2020 |
In 2020, France imported 76 Mt of oil and petroleum products. Of this, 13.3%, or 10.1 Mt, was imported from Russia. This amounted to 17.5% of France total 2020 requirement.
 |
| Fig. 132. France's Imports of Oil and Petroleum Products by Origin Country, 2020 |
In 2020, France imported 7.7 Mt of coal, of which 2.5 Mt, or 31.8%, came from Russia. This formed 32 % of France’s 2020 requirement.
 |
| Fig. 133. France's Imports of Coal by Origin Country, 2020 |
In summary, in 2020, France imported 20.2% of its total natural gas requirement, 17.5% of its total oil requirement, and 32% of its total coal requirement.
Summary of Europe’s Energy Dependencies on Russia
The above analyses were performed for all the major European countries. The results can be summarized in the following graphs, one each for gas, oil, and coal.
Let us first look at the graph for gas imports from Russia. It is clear that Russia forms 100% of gas imports for many countries in Europe, and a dominant percentage for a few other countries. The UK, Spain, Sweden, and France are noteworthy in the low levels of import of natural gas from Russia. But most of Europe is heavily dependent on Russian gas.
 |
| Fig. 134. Percentage of Total Gas Imports Originating from Russia, 2020 (UK: 2019) |
The countries of Eastern Europe are more heavily dependent on Russian oil imports, as the next graph shows us.
 |
| Fig. 135. Percentage of Total Oil Imports Originating from Russia, 2020 (UK: 2019) |
Much of Europe is also very dependent on Russian coal.
 |
| Fig. 136. Percentage of Total Coal Imports Originating from Russia, 2020 (UK: 2019) |
More important than the percentage of total imports is the percentage of a country’s requirements that Russian fossil fuels amount to. The graph below shows the percentage of a country’s national requirement for natural gas that comes out of its import of Russian natural gas.
 |
| Fig. 137. Percentage of National Gas Requirement Imported from Russia, 2020 (UK: 2019) |
Some percentages in the above graph are more than 100%, and the reason is that these countries act as transshipment hubs within Europe. They get Russian gas and sell it to other countries. In calculating the gas import from Russia, the ultimate supplier is considered. For example, when we look at Poland’s imports of natural gas, technically 54.8% comes from Russia and 20.6% comes from Germany. But Germany has no gas of its own to export to Russia. All the gas it is selling to Poland is actually Russian gas that it is sending via reverse flows on the pipelines. Similarly, Romania technically gets 44.8% of its gas from Russia and 52.8% from Hungary. But again, Hungary has no gas of its own to export to Romania. It is all Russian gas. The goal in this study is to understand the dependence on Russia. So when Germany gets 66% of its imports of natural gas from Russia, it exports some to other countries. The reason this export is not deducted from the figure treated as Germany’s import from Russia in the figures above is that the goal is to understand what will get cut off when sanctions are imposed: in Germany’s case, that 66% of the imports will get cut off, and in Poland’s case, 75.4% of gas imports will get cut off, and that is the important thing to note.
Similar adjustments are made while calculating imports of oil. Germany has no oil of its own to export. So when the Czech Republic’s oil imports are considered, 29.1% comes from Russia and 18.9% comes from Germany. But Germany’s oil is actually Russian in origin. Thus, the Russian dependence is actually 48% and not 29.1%.
 |
| Fig. 138. Percentage of National Oil Requirement Imported from Russia, 2020 (UK: 2019) |
As in the case of gas, some percentages are more than 100% because these countries act as transshipment hubs for Russian oil. Lithuania supplies to the other Baltic republics, Finland supplies Sweden, and so on.
The coal dependence is not as high for most European countries as the gas or oil dependence. But there is another aspect to this, and that is the fact that Europe has gradually been reducing its dependence on coal. With the exception of a few countries like Poland, most countries have weaned themselves off coal by now.
Nevertheless, it is useful to look at some countries which are highly dependent on Russia on multiple axes. Prime examples are Lithuania, with 55% of its gas requirement, 239% of its oil requirement, and 81% of its coal requirement imported from Russia; Slovakia, for whom the corresponding figures are 82%, 177%, and 32%; Finland, 73%, 167%, and 34%; Denmark, 117%, 33%, and 105%; Netherlands, 52%, 114%, and 55%; Hungary, 119%, 63%, and 11%; Poland, 70%, 82%, and 17%, and so on.
 |
| Fig. 139. Percentage of National Coal Requirement Imported from Russia, 2020 (UK: 2019) |
These three charts, viz., the amount of gas, oil, and coal imported from Russia as a percentage of the country’s total requirement – are the clearest way to understand the country’s dependence on Russia, with the right level of granularity. For instance, if the home heating in Germany is primarily driven by gas heating, and if most chemical processes use fired heaters powered by natural gas, then the percentage of the national requirement that is constituted by Russian imports of natural gas is very important. In the case of Germany, that number is 63%. That means that because of the sanctions imposed by Germany on Russia, it is not getting 63% of the natural gas it needs. Similarly, Finland imports 73% of its natural gas needs from Russia. That means that if natural gas is used to heat Finnish homes, most of that gas is coming from Russia, and Finland has to find a way to replace that 73% of its national requirement, which amounts to 1.7 billion cubic meters of gas. That’s a lot of gas.
Another way to understand Europe's fossil fuel dependence on Russia is through the use of energy flow diagrams, also called Sankey charts. These charts show quantities flowing from one country to another using arrows, the width of which are proportional to the quantity of goods flowing in that direction. Below, I show the energy flow diagram for the flow of natural gas from Russia to Europe. I consider primarily two flows: flows of gas from Russia to European countries on the one hand, and flows (supplies) of gas from all other sources — be those from domestic production, from other European countries, or from countries external to Europe, such as Qatar or Algeria, on the other hand. The idea is to understand how dependent Europe is on Russia. The sum of the two flows adds up to the national requirement of natural gas for that country. If Russia supplies the entirety of a country's needs, there is no flow to that country from other sources.
 |
| Fig. 139a. Energy Flow Chart Showing Russia's Gas Supply to Europe |
The next graph shows the energy flow diagram for oil flows into Europe. As in the previous graph, there are two flows for each country: flows from Russia and flows from all other sources, including domestic production.
 |
| Fig. 139b. Energy Flow Chart Showing Russia's Oil Supply to Europe |
The next graph shows the energy flow diagram for coal.
 |
| Fig. 139c. Energy Flow Chart Showing Russia's Coal Supply to Europe |
With the flows for each country known, one can look at the energy flows from Russia into the entire continent. Unfortunately, I found that this becomes very complicated to look at with a lot of countries, especially given that there are three flows for each country — one for gas, oil, and coal each, and from two sources: Russia and other sources. Things can end up looking like spaghetti very soon. To avoid this, I show below the energy flow diagram for fossil fuels from Russia into Europe for just three major economies, in order for the reader to understand just how tightly enmeshed Europe is with Russia.
 |
| Fig. 139d. Energy Flow Chart Showing Europe's Fossil Fuel Dependency on Russia |
But is there a quantitative way to measure overall energy dependence across multiple fuels? Actually, there is. We know the total energy supply that is required by each country in the above list, thanks to the data from the IEA. Every country in Europe is not part of the IEA, so the IEA does not have data on the total energy requirements of every country, but every country that is in the previous graphs (for which I have shown percentages of the national requirement) is part of that database. So now we know, thanks to the above graphs, how much of that national requirement comes from Russia. If we remove that energy from the mix, we now know what the new total energy mix for that country is. And thus we can measure the energy shortfall.
An example will make this clear. Let us consider the case of Finland. In 2020, Finland needed 88 PJ of natural gas energy, 299 PJ of energy from oil, and 118 PJ of energy from coal. Of that energy, it imported 73% of its gas energy from Russia, 167% of its oil energy (hence all) from Russia, and 34% of its coal energy from Russia. It also had 747 PJ of non-fossil energy (254 PJ of nuclear energy, 406 PJ of biofuels and waste energy, 57 PJ of hydro energy, and 30 PJ of wind, solar, and other renewable energies). Only the fossil piece is affected by the sanctions on Russia (at least directly). Since Finland will not be importing any more energy from Russia, the fossil pieces now become 27% of the original 88 PJ of natural gas energy, 0% of the 299 PJ of oil energy, and 66% of the energy from coal, or 24 PJ, 0 PJ, and 77 PJ, respectively, which when added to the non-fossil piece, gives a total available energy of 847 PJ. The shortfall in energy is therefore 1251 PJ – 847 PJ = 404 PJ, which in percentage terms relative to the original energy consumption becomes 32.3%. The shortfall in the fossil fuel energy alone is 404 PJ, which relative to the original 505 PJ, comes to an 80% shortfall.
In this way, the overall energy shortfall for all the European countries in the IEA database is calculated, and the results are shown in the next figure.
 |
| Fig. 140. Overall Energy Shortfall and Fossil Energy Shortfall in European Countries Due to European Sanctions on Russia, Based on 2020 Data (UK: 2019 Data) |
This is a very interesting graph. It tells us that Norway, Portugal, Spain, the UK, and France are the countries least affected by the sanctions, with energy shortfalls that are in the 10% range or lower. In contrast, Germany, the engine of Europe, has an energy shortfall of 34%. That means that Germany must either find a way to come up with that 34%, or it must shut down its industry or let its citizens freeze, or both. The country we just discussed, Finland, has a huge fossil energy shortfall, at 80%. But since its energy sources are quite diversified, as we have just seen, with nuclear and biofuels playing a big role, it was not too badly affected by the huge fossil energy shortfall, and has an overall shortfall of 32% (which is still very problematic.)
The worst-affected countries are the Netherlands, which has a total energy shortfall of 63.5% and a fossil energy shortfall of 72.2%; Lithuania, which has a total energy shortfall of 60.4% and a fossil energy shortfall of 81.1%; Greece, which has a total energy shortfall of 58.6% and a fossil energy shortfall of 69.9%; Hungary, which has a total energy shortfall of 53.9% and a fossil energy shortfall of 76.5%; Slovakia, with a total energy shortfall of 46.6% and a fossil energy shortfall of 77%; and Poland, with a total energy shortfall of 43.6% and a fossil energy shortfall of 49.1%.
But the fact is that all countries in Europe are in a bad situation, because anything close to 30% or greater in the total energy shortfall is a very serious situation, and only five countries, as already stated earlier – Norway (which is a net energy producer, so this is not a surprise), Spain and Portugal (which are saved by the fact that they get much of its supply from North Africa, the Persian Gulf, the US, and various other sources), the UK (which again is partly saved because it has its own production in Scotland, and also benefits from sea-borne oil and LNG), and France (largely because of its dependence on nuclear power) – are going to be able to survive the loss of Russian energy.
This explains why different European countries have different attitudes towards Russia, and why discussions between France and Germany on the subject of sanctions on Russia have been so tense. France can afford to sanction Russia, and so wants Germany to go along, but Germany’s position is a lot more precarious than that of France.
This graph also gives us a way to measure the effect of European sanctions on Russia. The rhetoric by most Western leaders, amplified faithfully by Western media, is that sanctions against Russia are a necessary inconvenience for the citizens of Europe because the sanctions “hurt Russia's ability to wage war by denying them income from sales of fossil fuels.” Well, we can see how true this is now. From the previous graph, we now know how much of an energy shortage each nation in Europe is facing on an annual basis. From the OEC data, we also know how much each of these nations has been spending on buying Russian coal, oil, and gas every year. If we look at the total amount each nation spends on Russian fuels per year, and calculate the percentage of total Russian exports that amounts to, we get a quantitative idea of how much revenue each nation would be depriving Russia of by refusing to buy their fossil fuels. Of course, as explained earlier, there are some strange anomalies in the way that the revenues for fossil fuels are accounted for in the OEC data. In particular, we saw that the revenue from gas exports to Germany from Russia was only seen to be $32 million in the OEC data, which is odd given that Germany imports 66% of its total gas from Russia and is the biggest importer of gas from Russia by volume (52.4 bcm). One possible explanation is that the costs are spread around different countries in some complex payment system. Regardless, we have to make do the best we can with the best available data. And so, in what follows, I use the OEC data to calculate how much each country spends on Russian fossil fuels. In this way, we can make a judgement as to how much suffering of European citizens is resulting in how much deprivation of income for Russia to continue its war against Europe. This graph is shown below.
 |
| Fig. 141. Cost-Benefit Analysis of European Sanctions on Russia |
What is clear from this graph is that no country in Europe is even causing a 6% dent in Russia's export income. The sum total impact of the 17 major countries considered here is just over 20% of Russia's export income.
The worst affected countries are Lithuania, Greece, and Hungary, which have energy shortfalls of 60.4%, 58.6%, and 53.9%, respectively, whereas their impacts on Russia's export revenues are 0.3%, 0.7%, and 0.5%, respectively. It is, of course, for the citizens of these nations to decide if their sacrifice is worth it, but clearly, they are losing between 50-60% of their total energy by sanctioning Russia, while each making about half a percentage point impact on Russia's revenues on average. Slovakia and Poland have energy shortfalls of 46.6% and 43.6%, respectively, while what they are getting in return for their sacrifice is a one to two percent impact on Russia's export revenues. Both Germany and Italy have close to a 3% impact each on Russia's export revenues; in return for this, they suffer energy shortfalls of 33.9% and 27.6%, respectively. Netherlands is the country with the greatest impact on Russia's export revenues, with 5.2% impact; but the price it pays for this “success” is a 63.5% overall energy shortfall.
Finland, Denmark, and Czechia have energy shortfalls of 32.3%, 31.4%, and 30.3%, respectively, and what they get for their sacrifice are impacts on Russia's export revenues of 1.1%, 0.3%, and 0.5%, respectively.
The UK, Sweden, France, and Spain are among the least-affected countries in Europe, with total energy shortfalls of 12.2%, 10.6%, 8.8%, and 8.3%, respectively, and they affect Russia's export revenues to the tune of 1.1%, 0.2%, 1.3%, and 0.5%, respectively.
Portugal and Norway are the least-affected of the 17 countries that I have investigated here, with energy shortfalls of 5.9% and 3.9%, respectively; they also have the least impact on Russia's export revenues, with impacts of 0.1% each. Clearly, no pain, no gain; but citizens of Europe have to decide for themselves if they are happy with this “gain” for this level of "pain."
We should also keep in mind that the total energy shortfall is a very optimistic number, because it treats all energy, whether it be gas, oil, coal, hydro, nuclear, or wind, as the same. In actual terms, these energies are not interchangeable. For instance, most home heating in Europe uses natural gas. You cannot use nuclear energy or wind energy or solar energy to substitute for gas heating in homes, because the mechanism is different. Home heating using gas relies on burning gas in a furnace to then heat water using the combustion gas and then using hot water pipes in the home. Home heating using wind or solar or nuclear energy relies on electric heating of the same water to heat the water in the pipes. One would have to completely change the heaters in every home to replace gas with nuclear or wind energy.
Similarly, if you have a chemical plant that is powered by coal heating or natural gas heating, you cannot substitute electrical energy for it. That would require a major redesign and take at least a year or two to convert. So what we should look seriously at is the individual graphs on the percentages of national requirements that were coming from Russia in 2020.
So if you lose your natural gas, then, in the short term, you lose whatever you used that natural gas for. If all your home heating was done using natural gas, you are in deep trouble. Nuclear energy will not save you until the next winter.
This segues into the next section, which deals with the coming de-industrialization of Europe because of the non-availability of fossil fuels.
Key Takeaways from Chapter IV
- Fossil fuels have an impact on European economies that cannot be measured in terms of their monetary value.
- Europe needs to import 22% of its total coal requirement, 38% of its total gas requirement, and 28% of its total oil requirement from Russia.
-
To replace the gas that Europe was importing from Russia would require the world to produce an extra 11% of the total world output of gas
- There isn’t that much spare production capacity
- Gas producing countries will only increase production if Europe commits to 20-25 year contracts
- It will take at least one year to get the extra supplies of gas
-
To replace the oil that Europe was importing from Russia would require the world to produce an extra 6.2% of the total world output of oil
-
This amounts to asking for an extra 2.4 million barrels a day to be produced
- OPEC+ has decided to cut production globally by 2 million barrels a day
-
This amounts to asking for an extra 2.4 million barrels a day to be produced
- Europe’s emergency stocks of oil will only last it for 45 days at the most
-
If Europe wishes to substitute coal for its shortage of gas and oil, it will require an additional 32% of the total world coal supply (excluding Russian coal)
- This is impossible for Europe to obtain
- Only five countries in Europe are less than 40% dependent on Russia for gas: Norway (0%), UK (5%), Portugal (10%), Spain (11%), and France (20%)
- Only six countries in Europe are less than 30% dependent on Russia for oil: Portugal (8%), Spain (10%), Norway (10%), France (18%), Italy (20%), and UK (22%)
- Only eight countries in Europe are less than 30% dependent on Russia for coal: Portugal (0%), Czechia (2%), Greece (11%), Hungary (11%), Poland (17%), Norway (19%), Sweden (22%), and Germany (23%)
- Only five countries in Europe have a fossil energy shortfall less than 30%: Norway (8%), Portugal (8%), Spain (12%), UK (14%), and France (19%)
- Only seven countries have an overall energy shortfall less than 30% (including all renewable sources of energy): Norway (4%), Portugal (6%), Spain (8%), France (9%), Sweden (11%), UK (12%), and Italy (28%)
CHAPTER V. THE DE-INDUSTRIALIZATION OF EUROPE
Industry Shutdowns
European industry has already started shutting down in response to the high costs and unavailability of energy. Because of this, demand for gas has been falling, and so price has been going down, even though supply has also decreased.
As this news report in BNE Intellinews says,
The closures could do long-term damage to Europe’s industrial base. In Germany, Europe’s industrial powerhouse, the most energy-intensive industries are already being hit hard by unsustainable costs: energy accounts for 26% of the metallurgy industry costs; 19% of basic chemical production; 18% of glass manufacture; 17% for paper; and 15% of construction materials, according to Destatis. European carmakers have already begun hoarding windscreens in anticipation of a glass shortage in the months to come.
Over half of Europe’s aluminium smelters have already been affected by the power crises. The EU has temporarily lost 650,000 tonnes of primary aluminium capacity, or about 30% of its total, Eurometaux said. Some of Europe’s biggest steel and chemical plants have also been taken offline and there is no clear idea of when they can start up again. And Europe's fertiliser industry association says more than 70% of the continent's fertiliser production has been either shut or slowed due to sky-high gas prices.
But, as already shown, Europe’s biggest problem is not one of price, but of supply. There simply isn’t enough gas, at any price, to power Europe’s homes and factories. The costs of gas have gone up, but that is not because of the price in the spot gas market. That is because Europe never had to rely on the spot gas market except for sudden spurts in demand. For the bulk of their needs, they were depending on gas that they were getting at an assured, low, locked-in price – thanks to the wisdom of Gerhard Schroeder and Angela Merkel. The spot market, from which they now have to buy the gas, is six to seven times as expensive.
One of the biggest casualties of the energy shortage is the chemical industry. Germany’s BASF, with sales of $93 billion in 2021, is the biggest chemical company in the world. Its largest facility is in Ludwigshafen in southern Germany, where it employs 39,000 people, in a facility that uses as much energy as all of Switzerland. And BASF has issued a warning that if the current situation continues for much longer, they will be forced to shutter down the Ludwigshafen plant. As this Fortune article says,
“A shortage of natural gas would…have a double impact on chemical production,” said BASF’s spokesperson. “On the one hand, there would no longer be enough energy available for the production processes, and on the other hand, natural gas would be missing as an important starting material for the manufacture of products. Natural gas cannot be substituted in chemical production in the short term, either as a raw material or as an energy source.”
“If supply were to fall significantly and permanently below 50%, we would have to shut down the production site while maintaining the necessary safety standards,” the spokesperson said. “If production is significantly curtailed or discontinued, significant impacts on the basic supply of the population (not only in Germany) and thus on the community can be expected.”
The problem with a prolonged period of high gas prices (and Europe has already seen high gas prices for five months or so now, because they are not getting gas at the contract rate of €15 per MWh or so that they used to pay Gazprom for gas from NordStream, but anywhere between €100 and €350 for the past few months, or 7 to 25 times the price they used to pay) is that once factories have to be shut down because it becomes unviable to operate them, customers go elsewhere. And once they go elsewhere, they may never come back. For the chemical industry, both gas and oil are not only fuels for energy, but also feedstocks (building block chemicals) to produce other chemicals. For instance, crude oil is the primary feedstock in making every kind of plastic and polymer in the world. Every polyethylene and polypropylene bottle comes from oil. Similarly, natural gas is the feedstock for making ammonia and nitrogenous fertilizer.
As the BASF spokesperson says in the above Fortune article,
According to Mayer, BASF’s warnings are unprecedented and show how deep its crisis is becoming. And he warns it is very likely that the Ludwigshafen complex is doomed regardless of rationing, since persistently high European gas prices reduce the competitiveness of BASF’s German products against rivals from the U.S. and Middle East.
“The problem is that, over the last two years, logistical costs have been so high that all markets have basically been regional markets,” Mayer said. “Now that logistical costs are down so much, all markets are open for imports. This is particularly the case for Europe. Cheaper products from outside Europe are now coming to Europe…Our expectation is that this situation will remain for the future.”
To combat those exorbitant European gas prices, BASF has already cut ammonia production at Ludwigshafen and another Verbund site in Antwerp, Belgium, and is now relying more on ammonia production in Freeport, Texas, where gas is much cheaper. Its complexes in the U.S., Malaysia, and China may help the company weather this crisis to an extent, but Mayer noted that it’s not just BASF that’s in trouble. “Energy-intensive businesses will partly or fully be closed down in Germany in particular,” he said, “but all across Europe there will be a capacity reduction.”
There have been various other warnings. In October 2022, Gerald Haug, the President of the German National Academy of Sciences, talking about the need to move extremely fast to renewable energies to counter the energy shortage in Germany arising from the sanctions, said,
“I’m very worried that if we don’t act now, we’ll lose entire industrial sectors — especially in the raw materials industry,” warned the Leopoldina President. “That would mean a much higher dependency on Asia and especially China.” For example, outsourcing the chemical industry completely from Germany and Europe would be a “fundamental mistake” — especially in view of the goal of climate neutrality by 2045.
Another industry that is extremely energy-intensive is the paper industry. Eight months of skyrocketing energy prices have pushed the European paper industry to the brink of collapse, as this report from August 31 explains.
German papermaker Feldmuehle is switching fuel from gas to light heating oil at short notice due to the gas supply crisis, which requires a €2.6m (£2.17m) spend. But that is just one, 250,000tpa mill.
Over the summer Norske Skog — which had already taken drastic action at its Bruck mill in Austria back in March with a temporary shutdown — said that raw materials and energy prices were expected to remain “high and volatile” in the second half of 2022, and may cause further short-term stoppages in production.
“The turbulent operating environment, especially on the energy side, may result in further temporary or permanent closures in the industry,” the group noted.
Corrugated packaging giant Smurfit Kappa opted to cut production by some 30,000-50,000 tonnes in August because “with the current price of energy there’s absolutely no sense whatsoever to make stock.”
European paper industry federation Cepi has warned that possible disruptions in the industry’s gas supply “would affect the entire logistics of the EU, availability of paper packaging for food and pharmaceuticals, as well as essential hygiene products.”
Flexible Packaging Europe has also flagged concerns over potential disruption to flexible packaging materials which are also made using continuous processes.
It’s not just the continent that is affected. Energy intensive industries in the UK are also struggling with the spiralling cost of energy here.
Papermaker Portals cited energy prices as one of the reasons behind the recent shock announcement that it planned to close its historic Overton banknote paper mill in Hampshire.
Over the short term, European governments are offering bailouts to companies such as BASF and Papermaker Portals to help them stay alive. But this is assuming that the crisis is temporary and things will come back to “normal” soon. But the problem with a shutdown is twofold.
One is that with some industries, such as glassmaking or steelmaking, you can never really afford to shut the plant down. A shutdown in a glass factory would mean that the nozzles that supply gas to the furnace that burns inside and releases heat can get clogged with glass and other residue. In normal operation, the high temperatures make sure that nothing solidifies on the nozzles. But once a furnace goes cold, all kinds of problems arise, and it may not be economical to revive a furnace after six months of disuse.
Two, if I own a steel mill and have customers in Japan and Brazil waiting for their orders, and I have decided to shut my plant down because of a gas shortage, they cannot wait for their steel — they will take their business elsewhere, say to China. And since most business operates on long-term contract to lock in low rates, they will not come back to me in six months if I tell them that my gas problem has gone away and I am open for business. Essentially, I have lost all my customers. The world waits for no one. As the BASF spokesperson said, even BASF is deciding to focus on fulfilling orders with their American operations.
Essentially, the gas crisis will mean the de-industrialization of Europe. And the winners will be the US, which has huge reserves of shale gas, and China, which is benefiting from getting gas very cheaply from Russia via the Power of Siberia line. In fact, the reason that Germany has been able to fill their storage tanks to more than 90% is that they have been furiously buying LNG from China because China is in the middle of a Covid-induced slowdown and so cannot use all the gas it got from Russia (this is discussed in more detail below). So it is liquefying the cheap gas it got from Russia and selling it back to Europe at huge profits. As this report from DW News from 16 September 2022 explains,
So far this year, Chinese companies have sold 4 million tons of LNG on international markets. That represents about 7% of Europe's gas consumption for the first half of the year. Evidence of this came from China's JOVO Group, an LNG broker, which said it had sold an LNG cargo worth as much as $100 million (€103 million) to a European buyer.
China's biggest oil refiner, Sinopec Group, also said it had been channeling excess LNG into the international market. Local media said Sinopec had sold 45 cargoes of LNG, or about 3.15 million tons.
“If Europe is buying LNG from China, then yes, potentially some of it may be Russian, if it's mixed in particular,” Anna Mikulska from the Center for Energy Studies at Rice University's Baker Institute for Public Policy told DW. “I do not believe there are any rules of content origin — in the end it is still an issue of displacement of volumes really.”
This seems like getting around sanctions on Russia, although the EU has not sanctioned Russian gas. Russia has systematically cut the supply and LNG markets are interconnected.
“There is nothing the EU can do beyond not buying from China but then exposing themselves to potentially serious gas shortages in the winter,” Mikulska added. “This way it's China and not Russia that captures the potential additional profits from reselling this gas.”
Russia's sales of pipeline gas to China grew by almost 65% in the first six months of the year compared with 2021. Since the Russian invasion of Ukraine, China's spending on energy imports from Russia has jumped to $35 billion, from $20 billion a year earlier, Bloomberg reported.
Russia's Gazprom and the China National Petroleum Corporation (CNPC) signed a $400 billion 30-year agreement in 2014 to build the Power of Siberia, a pipeline with a 3,000-kilometer (1,865-mile) section in Russia and 5,000 kilometers in China. The pipeline was launched in late 2019 and is expected to supply China with up to 38 billion cubic meters of gas a year once it reaches full capacity in 2025.
Experts warn that Europe cannot expect Chinese suppliers to cover its energy shortages, given that the total amount of gas that China can export to Europe is limited, compared with other sources like Russia.
Also, as economic activity revives in China, the situation will reverse, leaving Europe dependent on Beijing for its gas at higher prices.
The European metals industry is on the verge of an existential catastrophe. As of 6 September, 2022, 15 steel plants in Europe had been idled or completely shut down (see figure below). Steel production in July 2022 was down 6.7% y-o-y.
 |
| Fig. 142. Idled Steel Plants in the EU as of September 6, 2022, Because of Energy Shortages |
On 6 September, 2022, the President of Eurometaux, the Europeans Metals Association, wrote a letter to Ursula von der Leyen, President of the EU, in which he said that
Our sector has already been forced to make unprecedented curtailments in the last 12 months. We are deeply concerned that the winter ahead could deliver a decisive blow to many of our operations, and we call on EU and Member State leaders to take emergency action to preserve their strategic electricity-intensive industries and prevent permanent job losses.
50% of the EU’s aluminium and zinc capacity has already been forced offline due to the power crisis, as well as significant curtailments in silicon and ferroalloys production and further impacts felt across copper and nickel sectors. In the last month, several companies have had to announce indefinite closures and many more are on the brink ahead of a life-or-death winter for many operations. Producers face electricity and gas costs over ten times higher than last year, far exceeding the sales price for their products. We know from experience that once a plant is closed it very often becomes a permanent situation, as re-opening implies significant uncertainty and cost.
 |
| Fig. 143. Letter from Eurometaux to EU President Ursula Von Der Leyen, September 6, 2022 |
Also, as this report in the Financial Times explains,
On Tuesday, Aluminium Dunkerque, Europe’s largest primary smelter for the metal, said it would curtail production by 22 per cent because of high electricity prices. Outokumpu, the largest producer of stainless steel in Europe, also announced that it would delay the restart of one of its ferrochrome furnaces following maintenance. Ferrochrome is a type of alloy.
Aluminium, also known as “solid electricity”, is coming under a particularly acute threat because those smelters are extremely energy intensive, cannot easily adjust production volumes and are difficult to restart once halted.
Nick Keramidas, European and regulatory affairs director of Mytilineos, a Greek industrial conglomerate that produces aluminium, said the electricity, at current market prices, needed to produce a tonne of aluminium would cost about €10,000 but it would sell for less than €2,500. His company has long-term power purchasing contracts in place, he said, but the whole industry would struggle when contracts expire.
As a result of the current market situation, Eurometaux said that more smelters will shut at the start of 2023 once their hedging for this year runs out unless the EU makes urgent, far-reaching interventions in the power market.
Ami Shivkar, principal analyst of aluminium markets at Wood Mackenzie, a consultancy, said a further 600,000 tonnes of aluminium production was at risk of temporary closure in Europe in the next few months.
“To restart a smelter you need a humongous amount of capital,” she said in a warning that temporary closures can turn into permanent ones.
Also, on 6 September, 2022, an alliance of industry associations, including Fertilizers Europe; CEMBUREAU, the European Cement Association; Glass Alliance Europe; Euromines; EULA, the European Lime Association; EXCA, the European Extended Clay Association; Euroalliages, the Association of European Ferro-Alloy Producers; CEFIC, the European Chemical Industry Council; CEPI, the Confederation of European Paper Industries; EUROFER, the European Steel Association; Eurometaux, the European Non-Ferrous Metals Association; and Cerame-Unie, the European Ceramic Industry Association, wrote a joint letter to EU President Ursula von der Leyen (see image below), in which, they said,
With the EU gas peaking at 334 €/MWh TTF spot prices two weeks ago, which is 15 times its pre-crisis level, 10 times more than the US prices and well above the prices in Asia, it is clear that the relation with a normal market is lost. Beyond the current impact on citizens through inflation, destructive consequences on gas and electricity industrial users are inevitable.
The last weeks saw a great number of industrial plants shutting their doors or reducing their production in Europe and more are expected in the forthcoming weeks. These massive plants curtailments will increase Europe’s dependency on third markets for strategic supply chains and will drastically increase the global carbon emissions.
For many energy intensive industries there is currently no business case to continue production in Europe nor visibility and certainty for investments and further developments. The effects of those closures are also starting to have a severe impact on our value chains endangering European industrial base and the availability of essential products more broadly.
The letter goes on to plead for control of gas and electricity prices in order to help industry survive.
 |
| Fig. 144. Joint Letter from European Industry Associations to EU President Ursula Von Der Leyen, 6 September 2022 |
But there are some important issues to understand here.
A Crisis Long Overdue
The most important one is that Europe was already well into economic crisis much before the war began. This crisis did not begin in February 2022. We have to go back two years, to the start of the Covid-19 pandemic. Because of lockdowns and closures of complete economies, demand nosedived. Because of this, oil and gas companies closed down wells rather than run them unprofitably and extract oil with no place to send them to or store them. Gas prices hit rock bottom around June 2020 and then, in response to well closures, started stabilizing. But prices remained low until the following year, when demand started picking up in February 2021, as can be seen from the graph below. It is hard to pinpoint a time when the crisis “began,” so to speak, but gas prices started rising steadily in 2021, from about €15 per MWh on February 24, 2021 (exactly one year before the Ukraine war began), reaching a peak of about €115 per MWh on October 6, 2021 (That’s a rise of a factor of 7.7 in just 7.5 months.) Prices went down to about €60 per MWh by November 1, before rising again to €180 per MWh on December 21, 2021. Things cooled off again, so that, just before the war began, prices had gone down to about €75 per MWh. So, for the entire year before the war in Ukraine began, gas prices had been at least 4-5 times higher, and had been as high as 12 times the historic prices of gas, say two years prior. This price volatility had already caused contingency funds in Europe’s companies to dry up, so that by the time the war in Ukraine broke out, European industry was already standing on its last legs. Since then, Western sanctions on Russia have ensured that spot prices of natural gas have skyrocketed and, even when going down in response to reducing demand, remain quite high. In spite of European demand dropping by 25% on average since the start of the conflict, European gas prices today are at around €115 per MWh. After two years of high gas prices, and after losing guaranteed, low-price, contracted gas from Russia, European industry can no longer afford these energy costs. The spot market was never supposed to provide for the bulk of industry’s gas needs. It was there to absorb sudden spikes in demand. Yet, today, Europe’s industry is being forced to rely on the spot market for all its needs.
 |
| Fig. 145. Start of the Gas Price Crisis in February 2021 Due to Post-Covid Rise in Demand |
The second important thing to note from the 2021 gas crisis is that the price of gas hit some serious pain points, such as €180 per MWh — prices which would certainly have made national governments ask oil and gas producers to increase production and supply of natural gas. And yet, oil and gas companies were not able to increase production significantly to bring the price of gas back to pre-pandemic levels. This tells us that the supply of natural gas is fairly inelastic. And that means that today, too, when Europe has lost all access to Russian natural gas because of their own decisions — for many countries, losing between 40% - 100% of their total gas supply as a result — their ability to make up for this loss by increased production from gas producers is extremely limited. This means that there is no relief in sight for Europe’s beleaguered industry anytime soon.
Despite all the negative news for Europe, one factor has mitigated its problems. This has been China’s economic slowdown this year because of Covid. China is committed to a policy of “Zero Covid” — that is, they will not accept a single Covid case, even if it means completely shutting down business. Because of this, the demand for oil and gas from China has actually dropped massively. As a result, even though gas prices spiked when Russia said that it was stopping gas supply to Europe, it has been dropping ever since.
 |
| Fig. 146. Drop in EU Gas Prices Since the September 2022 Peak After the Rise Due to the War |
There are two main reasons for the dropping price of gas. One is, as just mentioned, that demand from China has dropped drastically. If and when the Chinese economy picks up, this picture will change.
Keep in mind that these are spot gas prices. Long-term contract rates are usually significantly lower (explained below) than these prices. There are people in Europe and the US who are rejoicing that the spot gas prices in Europe have come down significantly since the highs of late September — they are now trading close to €130 per MWh after going down as low as €95 per MWh.
But this is no cause for celebration. The fact is that before the war began, and even during the war, Europe was never paying the astronomical spot rates that were appearing on the TTF exchange. That is because the gas flowing through Nord Stream was being paid for by Europe at a contracted long-term rate. In fact, the gas price in Europe has only shot up in the last two years. For years, the price of gas per MWh in Europe was hovering around 15 Euros. During the pandemic, because of slowed demand, the price dropped precipitously, but in June 2020, the spot price started picking up in response to increased demand. But the price paid by Germany to Russia remained the same. That is the advantage of a long-term contract — you can lock in a low rate and protect yourself from volatility. The problem for Europe today is that there is no contract with Russia, and so Europe has to buy spot gas at the market. So Europe is paying €120 per MWh for gas that they were earlier getting at €15 per MWh as per the contract. This is why companies across Europe are going bankrupt. Their financial models cannot handle such a high cost of fuel.
Even this eightfold cost increase is so low only because of the demand slowdown in China. If the Chinese economy were to pick up, gas costs in Europe would go up twenty-fold relative to their earlier long-term contract rates.
Despite this reality, the fact that demand is low in China is temporary relief to Europe. The other factor that has reduced the pain of high gas prices in Europe is that demand for energy in Europe has gone down because of industry shutdowns, as can be seen from the figures below. While there has been an overall decrease in demand for natural gas between January and October, the drop in demand in October has been particularly precipitous. This indicates the rapid de-industrialization of Europe.
 |
| Fig. 147. Drop in EU Gas Demand, January to October 2022 |
 |
| Fig. 148. Drop in EU Gas Demand, October 2022 |
Natural Gas as a Feedstock
Natural gas is important not only because it is a source of energy, but because it is a feedstock. One of the most important ways in which natural gas is important to people is that it is used to produce ammonia, which is then converted into nitrogenous fertilizer, such as ammonium nitrate and di-ammonium phosphate (DAP). The natural gas shortage in Europe has had huge effects on the production of fertilizer in Europe. This, in turn, will seriously affect Europe’s ability to grow food in the coming years.
Norwegian chemical company, Yara, operating in Italy, France, Norway, and Germany and German ammonia producer, SKW, as well as German chemicals company, BASF, have reduced ammonia production.
In the UK, CF Fertilizers has already scaled down production and began plans to cease production, according to ICIS data.
In Spain, Fertiberia has closed some plants and lowered production in others. Yara and OCI have curtailed urea and ammonium production in the Netherlands, while Yara and BASF in Belgium have also restricted production.
In Poland, Grupa Azoty and Anvil reduced production. In Romania, Azomures' activity slowed. The Duslo company in Slovakia stopped production while Nitrogenmuvek suspended production in Hungary.
Agropolychim and Neochim companies closed in Bulgaria. In Croatia, Petrokemija's urea and ammonia production facilities closed. In Lithuania, Achema has suspended production while Lifosa has temporarily deferred production.
According to a report in the Independent Commodity Intelligent Services (ICIS), this capacity is unlikely to return to Europe. One of the key reasons for this, as the Centre for European Policy Studies (CEPS) explained in its 2014 report on ammonia, is that the cost of natural gas is, by far, the biggest factor in the cost of ammonia, as seen in the figure below.
 |
| Fig. 149. Components of Ammonia Cost in Different Geographies |
Since 2014, the cost of natural gas has become much lower in the US because of the expansion of shale gas production in the US. So this same graph will look much worse for European ammonia production today. Thus, current European ammonia (and hence fertilizer) production was already being done with some serious headwinds. With cheap American gas, and with Russian gas vanishing from Europe, fertilizer production might just be completely doomed.
What is making things worse for fertilizer production in Europe is that the EU is not self-sufficient in ammonia production for fertilizer. The chart below (from the ICIS report of 2014, but things have not changed dramatically today) shows the partitioning of ammonia production in the world.
 |
| Fig. 150. Top Ten Global Ammonia Producers, 2012 |
If natural gas is getting too expensive for Europe to make ammonia in the EU, would it be possible for it to import it from other countries?
China, Russia, and Ukraine are leading world exporters of fertilizer — including ammonia, as seen in the figure above. However, in 2021, China imposed a blanket ban on all exports of fertilizer in order to secure its own domestic supplies. As a result, a huge piece of the world supply pie vanished. India’s production does not really matter, as most of it is used for internal consumption. That left Europe with only a few major suppliers — Russia, the US, Ukraine, Trinidad and Tobago, Indonesia, and Canada. But Indonesian fertilizer is also largely for domestic use. But after the war in Ukraine began in 2022, both Russian and Ukrainian supplies went off the radar. Ukraine was too busy fighting a war, and Russian supplies were blocked from being sent to Europe because of sanctions. Russia used to ship most of its ammonia to Europe via Odessa in Ukraine and via Estonia and Latvia in the Baltic sea, and both routes are now blocked because of European sanctions. So Europe is not getting ammonia from Russia because of the sanctions it has imposed on Russia. The fertilizers themselves are not subject to sanctions, but transport of Russian cargo through these regions is not allowed. So, in an attempt to punish Russia, Europe (yet again) is shooting itself in the foot.
So, now more than 58% of the global ammonia production is off-limits to Europe. It is elementary to guess that this will lead to a spike in ammonia prices and, hence, fertilizer prices in Europe, and this is exactly what has happened, as can be seen in the chart below.
 |
| Fig. 151. Rise in Fertilizer Prices Since February 2021 |
But, as in the case of natural gas prices, it is important to note that the spike in fertilizer prices did not start on February 24, 2022, when war broke out in Ukraine. It had been increasing since February 2021. For example, as can be seen from the above figure, the cost of urea went up from $200/metric ton to about $600 just before the onset of war, and then spiked to $800, before coming back down; the price of DAP went up from about $300/metric ton in November 2020 to about $800/metric ton before the onset of the war before spiking to $1100 before coming back down. So what the war has done is make an already bad situation worse.
Of course, with fertilizers, it is not just ammonia that is the problem, because Europe does not produce that much fertilizer anyway. Most of it is imported, because the leading producers of fertilizer are outside Europe. Russia, Belarus, and Ukraine are leading exporters of all three types of fertilizers (N, P, and K), as the chart below shows.
 |
| Fig. 152. Market Share of Russia, Ukraine, and Belarus in Major Fertilizers |
With no viable route to fertilizer supplies from these three countries because of war and sanctions, Europe (as well as the rest of the world) is staring at a major fertilizer crunch. This is yet another indication of how important Russia is to the world, and why we must not rely too much on the words of an ignorant and jingoistic American Senator in judging Russia’s importance to the world economy.
A scarcity of fertilizers will lead to a huge food crisis in the world and in Europe as well. This may not be reflected immediately because of stockpiles of fertilizers that every country has for the purposes of food security, but will be obvious in the next sowing cycle when these reserves run out.
But there are other ripple effects of the fertilizer crisis. One of those is a carbon dioxide crisis. To understand this, we must understand how ammonia is made. Natural gas is mostly composed of a gas called methane, with the chemical formula CH4. Natural gas is reacted with steam and air in a process called steam reforming, which converts methane (CH4), oxygen (O2) from the air, and water from steam (H2O) to carbon dioxide (CO2), carbon monoxide (CO), and hydrogen (H2). In addition, there is the nitrogen (N2) from the air. After separation and conversion of the carbon monoxide to carbon dioxide, the carbon dioxide is separated. The nitrogen from the air and the hydrogen produced in steam reforming are then separated and reacted together in a process called the Haber process for ammonia production. So carbon dioxide is a major byproduct of the ammonia production process. This CO2 is then used to create fizzy drinks such as Coca Cola, as well as fizzy beers. Now, most beer and soft drink companies are suffering from a shortage of carbon dioxide. This is putting the future of the entire European beer industry at risk.
There are other problems for the food industry arising from the shortage of carbon dioxide that are even more serious than flat beer. One is the use of carbon dioxide as a preservative. Potato chips and meats are often packed in a carbon dioxide atmosphere so that the food does not spoil in the presence of oxygen. Carbon dioxide is also used in its solid form, also known as dry ice, to keep food refrigerated. It is also used to decaffeinate coffee in a process called supercritical extraction, in which carbon dioxide, because of its unique properties, is transformed into a state known as a supercritical state, in which it acts as a solvent and can extract the caffeine out of coffee seeds. Carbon dioxide is also used to humanely kill cattle by asphyxiating them in slaughterhouses.
As this example shows, the world is very interconnected, and the lack of one key commodity, viz., natural gas, has consequences that can break a whole range of downstream industries.
The Impact of the Oil Price Cap
So far, we have only talked about the effect of the disappearance of natural gas from Europe’s landscape. But there is another looming blow that Europe is about to inflict on itself. On October 6, 2022, the EU voted to cap the price at which Russia could sell oil to any country. The actual price is yet to be determined and will be announced on December 5, 2022, at which point the oil price cap will take effect. This cap will be enforced through insurance agents. Most shipping worldwide is insured by Lloyd’s of London. The oil price mechanism works by requiring Lloyd’s to only insure oil tankers if they can give a written, verifiable undertaking that the oil they carry from Russia will be sold at a certain maximum price. Russia has reacted to the announcement of the oil price cap by the EU by saying that it will simply not sell oil to any country that supports the oil price cap. The question, then, is, who is bluffing here, and who will blink. The West thinks, wrongly, that Russia will be crippled if its oil sales are prevented, and so it will tamely acquiesce to an oil price cap. But, as has already been shown, the revenue that Russia gets from Europe for its oil sales (including both crude and refined oil) is of the order of $65 billion, or 20% of its total export revenue. Given that Russia’s total exports are of the order of $330 billion, based on 2020 data, and based on the fact that it is a $1.8 trillion economy this is not a debilitating blow, although it is a loss of revenue. So Russia can let this revenue go and carry out its threat of not selling oil and oil derivatives to Europe. But what Europe will lose if Russia does this is far more substantial. To recapitulate some of the figures described earlier, Finland, the Netherlands, Slovakia, and Lithuania are completely dependent on Russian oil products (crude and refined); Greece is dependent up to 96%; Poland, 82%; Czechia and Hungary, 63% each; Germany, 39%; Sweden, 38%; Denmark, 33%; the UK, 22%; Italy, 20%; and France, 18%. Other countries will also lose more than what appears on paper, because currently some countries import far more than they need: Finland imports 167% of its national requirement of crude and refined oil; Lithuania, 239%; the Netherlands, 114%; and Slovakia, 177%. Many of these excess volumes are likely being re-exported to neighboring countries. To say that such catastrophic losses of crude oil and refined oil products will completely cripple these economies is to massively understate the scale of the problem. The graph below shows the final distribution of the total energy in Europe.
 |
| Fig. 153. Final Energy Consumption by Sector in the EU, 2020 |
Roughly a third of the energy goes into household heating, a third into transportation (cars, the metro, Eurorail, internal railways in European countries, tramways, buses, planes), and a third into industry. When winter arrives, you cannot let people freeze, so the energy for home heating will have to continue as before, so both transportation and industry will suffer in shares more than proportional to their dependence on Russia. For instance, since Poland depends 82% on Russian oil and oil products, most of their cars will be off the road, and most of their industry will have to shut down. Most European cities will run out of petrol and diesel for their cars and trucks. Not having petrol (gasoline) for cars may just be an inconvenience; but not having fuel for trucks means that goods cannot be transported to supermarkets. Goods cannot be transported from ports inland to factories which need them, via road or rail, if there is a shortage of diesel and gasoline. People will find it difficult even to take public transport to commute to other cities, because such services will have to be severely rationed in the absence of oil from Russia. One thing needs clarification here. The price cap that is being enforced on December 5 will only affect crude oil, not derivatives such as gasoline and diesel. So, to the extent that Europe is importing crude and refining it itself, it will be affected by the oil price cap because Russian crude will vanish from Europe. But Russian petrol, diesel, kerosene, fuel oil, and aviation fuel will still be imported into Europe until February 5, 2023, at which time a ban on all oil related product imports into Europe will go into effect. Of the $65 billion of oil and oil derivatives that was imported into Europe in 2020, 60% was crude oil and 40% was refined crude. That means the financial impact on Russia of the price cap of December 5, 2022, will be the loss of $39 billion (60% of $65 billion), which is just 11.8% of its total export revenues. The December 5 oil price cap will apply to crude oil, not to oil derivatives; however, Russia might, in response, decide to stop deliveries of both crude and refined oil to Europe. We simply do not know how they will respond at this time, and so must assume the worst.
But it is the industry piece that is the most interesting, because its effect on the economies of European nations is not transitory. As in the case of natural gas, crude oil, too, is an important feedstock. The entire plastics industry runs on crude oil. According to a 2022 article in Chemical & Engineering News, the world’s most valuable chemical company was the German company BASF, with $93 billion sales in 2021. Sixth on the list is British company INEOS, at $39.9 billion. Eighth on the list is Dutch company Lyondellbassell, at $39 billion. At #21 is German company Covestro, with $18.8 billion. At #23 is German company Evonik, with $17.7 billion. At #24 is British company Shell, with 2021 sales of $17.0 billion. At #35 is Belgian company Solvay with sales of $13.5 billion. At #37 is French company Arkema, with sales of $11.3 billion. At #42 is British company Johnson Matthey, with sales of $10.4 billion. At #45 is Austrian company Borealis, with sales of $10.2 billion. At #49 is German company Lanxess, with sales of $8.9 billiion. There are other European companies in the list, but what is notable about the companies mentioned above is that all of them are petrochemical companies. They rely entirely on crude oil as a feedstock. The list above should give an idea of the value that depends on crude oil. The total 2019 sales of plastics (polymers) in Europe amounted to more than $350 billion. In 2019, Europe produced 57.9 million tonnes of plastics.
The total demand for polymers in Europe in 2019 was 50.7 million tonnes. Of that, Germany constituted 24.2%, while Italy was 13.8%, France was 9.5%, Spain was 7.8%, the UK was 7.1%, and Poland was 7%. Plastics affect every aspect of life, from containers to spectacle frames to clothes and jackets to automotive parts to electronics packaging to adhesives to paints and coatings to films to appliances to toys to bicycle tires to rubber items to wire sheaths and food packaging.
Plastics would be impossible without crude oil and its derivatives, and one can directly treat a drop in the supply of crude oil to a country as the drop in polymer production in that country. So, for instance, since BASF had sales of $93 billion in 2021, we can say that, since Russia contributes to 39% of Germany’s annual crude oil requirement, BASF’s sales will go down by $36 billion. That’s the kind of hit European chemical companies are going to take when they go ahead with that oil price cap on Russia. If you just take the German chemical companies mentioned in the list, the cumulative loss in sales for these companies because of the lack of oil from Russia will be $54 billion, based on 2019 sales figures. If you count all the European polymer manufacturers I have listed above, then the total loss that Europe’s polymer chemical companies are going to suffer because of the decision to impose oil price caps on Russian crude will be $109 billion.
In short, Russia will suffer a 20% loss of its sales, to the tune of $66 billion. Eleven European chemical companies, combined, will suffer a 39% loss of sales, to the tune of $109 billion.
But the pain does not end there, because European citizens will still need these plastic and polymer items for daily use. For example, you need glue for various things or plastic toothbrushes or plastic bottles or bags. If European companies cannot supply those goods for daily use, then Europe must import those from China or the US at very high prices, and the costs will be passed on to the consumers.
More than Oil and Gas
Most of the attention in the last nine months has focused on the energy piece. But Russia is far more than just oil and gas. Some recognition of this fact finally dawned when an agreement was brokered between Ukraine and Russia by the UN and Turkey, which allowed Ukrainian grain to leave Black Sea ports to supply grain worldwide. This is because Russia and Ukraine are both leading suppliers of wheat. As a result of the territory Russia has conquered in this war so far, some of Ukraine’s agricultural and mineral wealth has fallen into Russian hands. Hence it is worth looking at the resources of both countries. Russia is the world's largest producer of wheat, and Ukraine is the fifth (see figure below).
Russia is also the second-largest producer of sunflower oil, after Ukraine.
 |
| Fig. 154. Top World Producers of Wheat, 2020 |
 |
| Fig. 155. Top World Producers of Sunflower Oil, 2020 |
As was discussed in the previous section, Russia is a major producer of fertilizer in the world. Russia ranks second in the world in potash fertilizer production, fourth in the world in phosphate production, and fourth in the world in nitrogen fertilizer production. Overall, Russia is the world’s largest exporter of fertilizer, accounting for 23% of ammonia exports, 14% of urea exports, 10% of processed phosphate exports, and 21% of potash exports.
Russia and Ukraine combined produce more than 24% of the world’s titanium. Ukraine has 140 million tons of manganese reserves, second only to South Africa at 200 million tons. Russia and Ukraine are the 6th and 7th largest producers of graphite in the world. Russia is the 6th largest producer of uranium, and Ukraine is the 9th largest producer. Ukraine and Russia produce about 70% of the world’s supply of neon gas, and about 40% of the world’s krypton gas. The two countries, combined, produce 6.6% of the world’s iron ore, but have nearly 18% of total known reserves of iron ore. Russia is also the third-largest producer of gold (9%) in the world, and has the third-largest known reserves of gold in the world (9.8%).
 |
| Fig. 156. Top World Producers of Gold, 2021 |
The graphs below (data from USGS) give some idea of the dominant presence of Russia in the minerals space. Many of these minerals are not huge in tonnage but are very important. For example, titanium and vanadium are very important in high-strength alloys. Tellurium is extremely important in solar panels. The important thing to realize here is that Putin has several levers he can crank to greatly increase the pain dial on the West; he has shown restraint and not done so in the face of the aggressive sanctions by the West. If Putin were to ban the sale of these minerals to the West, many industries would find the going quite tough. Let us look at some of these minerals.
These are production numbers, not export numbers, and so do not directly indicate the importance of Russia and China. For many of these commodities, it was not possible to get export numbers in terms of tonnage. However, especially for Russia, production is directly relatable to export volume, because Russia's population is not very large, and hence cannot absorb large volumes of commodities. This is certainly true of wheat and sunflower oil. But for many other commodities, a large share of production is itself indicative of market control, because these materials are not high-volume commodities. For example, a commodity like germanium or gallium is used in small quantities. There is no way that Russia or China can use that much germanium or gallium for internal consumption; and so, they must export it. Also, ike natural gas for Europe, the value of gallium is way higher than its market price would indicate. It is a vital and essential mineral for semiconductor manufacture. A similar story holds true for rare earths. Most modern electronics, such as mobile phones, are heavily dependent on rare earths.
For some items, top exporters are listed in terms of export revenues (dollars) on the OEC website. When possible, I have given that information as well. Of course, as expected, the trend in exports does not always follow the trend in production. There are some things that complicate matters. One is the buying and selling of commodities. A particular example is that of precious metals and jewels. The UK is seen as one of the top importers as well as exporters of gold and platinum, even though the UK does not mine either of these metals. The reason for this is the London Bullion market, which buys and sells precious metals. Similarly, India is seen both as a top importer and exporter of diamonds. The reason is that India is one of the world's hubs in diamond processing. Similar things occur in the chemical industry. An example is the import of lower purity silicon to produce higher purity (for semiconductor) silicon. In this case, the same country is listed as both an importer and an exporter of silicon. This becomes clearer when we look at lists of commodities with the purities specified. Similarly, a country which is a majority producer of a metal ore might not be listed as the leading supplier of that metal itself But without the ore, no one else can manufacture the metal.
The whole exercise can get exceedingly complex. Sometimes raw materials on the OEC website are not listed singly in commerce lists of materials, but in groups. This makes it hard to relate the production of a single mineral as seen on thet USGS datasheet with export numbers from the OEC site. Sometimes, there are various grades of a single mineral, from ore to 99.9999999% purity, and different countries are involved in this value chain. One such example is the case of iron, where we have iron ore, wrought iron, pig iron, sponge iron, steel, carbon steel, stainless steel (which itself involves various other metals, such as manganese and molybdenum). Who is important? The ore miner? The steel producer? The stainless steel producer? The answer is that all of them are important to the global economy. If anything, what this exercise shows is that economic sanctions are fundamentally wrongheaded in an interdependent world. Still, whenever possible, I have shared export numbers from the OEC website in the discussion below. What I hope the reader takes away from this section is an understanding of how vital both Russia and China are to the world economy, and how many links in the chain they occupy. This is why the sanctions idea was stupid right from the start.
But still, even without export information, the production numbers in the USGS report are themselves very important in the context of sanctions, because they indicate self-reliance. For instance, if China is the world's largest producer of sulfur, then it is mostly, if not entirely, self-reliant in sulfur. If China is the number one producer of a number of commodities, then embargoing it will not hurt China. A similar story holds for Russia. And, in the context of the "no-limits" partnership between China and Russia, if one of these two countries is self-reliant in a a particular mineral, that means that the other country is, too.
With that preamble, let us consider several commodities in which Russia is a world-leading producer. Let us first continue with the agriculture piece. The OEC data on wheat exports mirrors the USGS data on wheat production that was shown earlier. Russia and Ukraine export 19.5% and 9% of world wheat totals, in the same proportions that they produce wheat.
 |
| Fig. 157. Exports of Wheat by Origin Country, 2020 |
It is instructive to see who imports wheat, and who, therefore, is greatly impacted by the absence of 27.5% of world wheat output. This can be seen from the distribution of world wheat importers.
 |
| Fig. 158. Importers of Wheat by Destination Country, 2020 |
Clearly, wheat has a global impact. We can drill down deeper into this, to understand the countries which are directly impacted by Russian wheat exports. Russian wheat exports account for about $10 Bn out of the global total of $51 Bn, nearly 20%. The figure below shows where this wheat goes.
 |
| Fig. 159. Importers of Russian Wheat, 2020 |
From this figure, it is clear how important Russia is to so many countries in Asia and Africa. This goes a long way in explaining why these countries are extremely reluctant to criticize Russia. No amount of threats or exhortations or sanctions from the West is going to change that. People need food, and they will find ways to pay for them. If you force them to choose between the dollar and survival, they will abandon the dollar and choose survival.
Another agricultural example is the previously-cited one of sunflower oil. We had seen the total production of sunflower oil. The data from OEC shows the export of both sunflower seeds and safflower oil, both of which are vital food commodities in large parts of the world.
 |
| Fig. 160. Exporters of Sunflower Seeds, 2020 |
 |
| Fig. 161. Exporters of Sunflower seed and safflower oil, crude, 2020 |
The second image from OEC corresponds closely to the earlier-shared graphic on production of sunflower oil by country. The same countries in that chart are the chief exporters. One of the things this example highlights is how a product can be represented in multiple categories on the OEC site. Sunflower oil can be manifested as oil seeds or as crude sunflower oil, so it is important to track both. Also, places where sunflower is grown are also places where safflower is grown, and both are important sources of cooking oil.
If we just take the Russian exports of sunflower and safflower, shown above, and see who imports them, we again get an idea of Russia's importance to the developing world. In particular, shortages of sunflower and safflower oil are felt acutely in India. This is another reason why India is not keen on imposing any kind of sanction on Russia.
 |
| Fig. 162. Importers of Sunflower seed and Safflower Oil, crude, 2020 |
Continuing with the agriculture theme, let us look at exports of fertilizers. The next graph shows the leading exporters of urea, one of the most important nitrogenous fertilizers.
 |
| Fig. 163. Exporters of Urea, 2020 |
This graph makes sense, because urea is made from ammonia, which is made using natural gas as a feedstock. And so, the leading natural gas producers are the ones who make both ammonia and urea. Essentially, natural gas is transformed into carbon dioxide and hydrogen; the hydrogen is reacted with nitrogen in the air to form ammonia, and the ammonia and carbon dioxide are reacted to form ammonium carbamate, which is converted into urea. So all this is typically done in an integrated fashion. That is why you see the leading producers of urea, above, are the major gas producers: Russia, Saudi Arabia, Qatar, Oman, Algeria, Indonesia. At 11.3% of world total, Russia is the leading exporter of urea in the world. It is also the second-largest exporter of ammonia in the world, as the following chart shows. This chart also highlights the difficulty of understanding the importance of global players. How much of natural gas does a natural gas producer decide to export as natural gas? How much do they decide to convert to ammonia? How much of that ammonia is converted to urea? These are business decisions each country makes. But having vast supplies of a key feedstock (in this case, natural gas) is critical in the value chain.
 |
| Fig. 164. Exporters of Ammonia, 2020 |
Let us continue the discussion of agricultural exports by talking about one more key ingredient in agriculture: potassic fertilizers. As everyone knows, agriculture requires three families of fertilizers - nitrogenous (N), potassic (K), and phosphatic (P) fertilizers. Sometimes, these can be mixed, as is diammonium phosphate (DAP), which is a mixed N-P fertilizer. Most potash fertilizer is found in mines as potassium chloride (hence called K-fertilizer, from the Latin word for the element potassium, Kalium). The graph below (from USGS data) shows the top global producers of potash in the world.
 |
| Fig. 165. Top World Producers of Potash, 2021 |
Russia is the second-largest producer of potash in the world, at about 20%, after Canada. Its ally, Belarus, follows closely behind, at around 18%. Together, they produce 38% of the world's supply of potash.
Exports are more relevant to global supply than production, so the graph below shows the major exporters of potassic fertilizer in the world.
 |
| Fig. 166. Exporters of Potassic Fertilizer, 2018 |
Russia is the third-biggest exporter of potash, after Canada and Belarus. As with production, along with Belarus, Russia controls almost 38% of the world's supply of potassic fertilizer. The two graphs below show who is importing these fertilizers from Russia and Belarus. To imagine that these countries will risk their food security by supporting sanctions against the providers of such crucial raw materials is overly optimistic. Only Europeans could be so unrealistic.
 |
| Fig. 167. Importers of Potassic Fertilizers from Russia, 2020 |
 |
| Fig. 168. Importers of Potassic Fertilizer from Belarus, 2020 |
The third category of fertilizers is phosphatic fertilizers. Phosphatic fertilizers are obtained from deposits of phosphate rock, which are deposits of phosphorous-containing rocks. These are then processed to get phosphorous and, from it, phosphoric acid, from which phosphatic fertilizers are made. The graph below shows the top global producers (miners) of phosphate rock.
 |
| Fig. 169. Top World Producers of Phosphate Rock, 2021 |
It can be seen that Russia is the fourth-largest producer of phosphate rock, at 6.4% of global output, after China (39.1%), Morocco (17.5%), and the USA (10.1%). However, for global supply, it is important to see the top exporters, not just producers. This is shown in the next graph.
 |
| Fig. 170. Exporters of Phosphatic Fertilizer, 2020 |
We can see that China and Morocco are again the top two exporters of phosphatic fertilizer, but the export shares of the US and Russia have come down greatly. Very likely, this is because of the high internal consumption within these two countries (Wheat for Russia and Corn for the USA). But certainly Russia is self-sufficient in phosphatic fertilizer, being a net exporter at about 0.6% of world total.
Phosphate is converted to phosphorous and then to phosphoric acid. The phosphoric acid may be converted to a fertilizer such as monoammonium phosphate (MAP) or diammonium phosphate (DAP), or just exported as such. A good portion of China's phosphoric acid is also directly exported, as seen in the graph below.
 |
| Fig. 171. Exporters of Phosphoric Acid, 2020 |
Let us now come to minerals. Aluminium is a major commodity. Without aluminium, you cannot build cars and airplanes. China produces 57% of the total world output of aluminium. Russia is the third-largest producer of aluminium in the world, at 5.4%. The US imports 44% of its aluminium needs. The graph below, using data from the US Geological Service (USGS), shows the major producers of aluminium.
 |
| Fig. 172. Top World Producers of Aluminium, 2021 |
We can also see the major exporters of aluminium in the graph from OEC below.
 |
| Fig. 173. Exporters of Aluminium, 2018 |
The exports chart looks quite different from the production chart. A big part of the reason is that aluminium is a major input to any economy. India produces a lot of aluminium, but uses all of it. China also uses a lot of the aluminium it produces, but produces sufficient excess to still be the world's top exporter. Part of the problem for aluminium is that aluminium is mainly mined as alumina or bauxite, which are then refined to produce aluminium metal. A lot of the ore is exported by China and the final aluminium is produced by the destination countries. Unfortunately, export data on alumina and bauxite was not available for comparison.
Next, we come to one of the most important metals in the world: iron. Iron and steel are the most important construction metals in the world because of their strength and durability. However, because iron is so widely used, in so many forms, it is very hard to track its value chain. There are countries that mine iron ore, but those are not necessarily the countries that refine the ore and produce elemental iron. Even in elemental iron, there are various grades, from wrought iron to pig iron to steel to carbon steels with different levels of carbon in them, as well as stainless steel and various alloys of iron. Iron, as well as steel, may be bought and sold in various forms. One country may buy ingots of steel and export steel pipes; another may buy pig iron and sell steel; some may buy ingots of metal and make wire. All this makes tracking iron and steel very difficult. But I have tried my best to give a reasonable idea of the importance of Russia and China in this regard, which is the focus of this article.
The USGS data gives production data on the mining of iron ore. This is, of course, the basic step in the process. The graph below shows the top iron ore producers in the world.
 |
| Fig. 174. Top World Producers of Iron Ore, 2021 |
 |
| Fig. 175. Exporters of Iron Ore, 2020 |
 |
| Fig. 176. Top World Producers of Pig Iron, 2021 |
 |
| Fig. 177. Top World Producers of Raw Steel, 2021 |
China is the world's leading producer of pig iron, at 64.1% of global production, and the leading producer of raw steel, at 57.3% of global production. Russia is the fourth leading producer of pig iron in the world, at 3.9% of global output, after China, India, and Japan. It is also the sixth leading producer of raw steel in the world, at 3.8% of global output.
However, China has been growing at such a high rate that despite its production of iron ore, it needs to import iron ore for its own needs, as can be seen from the graph below.
 |
| Fig. 178. Importers of Iron Ore, 2020 |
China imports more than 70% of the global iron ore exported in the world. Russia, however, is the top exporter in the world of pig iron, the basic product of the blast furnace that produces iron from iron ore, at more than 28% of world exports, as the following graph shows.
 |
| Fig. 179. Exporters of Pig Iron, 2020 |
 |
| Fig. 180. Exporters of Iron Ingots, 2020 |
 |
| Fig. 181. Importers of Pig Iron from Russia, 2020 |
China exports roughly a fourth of the global trade in iron pipes, iron cloth, and iron wires, and almost half the supply of iron nails in the world.
 |
| Fig. 182. Exporters of Iron Wire, 2020 |
 |
Fig. 183. Exporters of Iron Pipes, 2020 |
 |
| Fig. 184. Exporters of Iron Cloth, 2020 |
 |
| Fig. 185. Exporters of Iron Nails, 2020 |
China is also the second-largest exporter of stainless steel wire, after India.
 |
| Fig. 186. Exporters of Stainless Steel Wire, 2020 |
A similar story is seen with copper. The graph below shows the leading producers of copper ore in the world. China is third in the world in copper extraction (by ore) at 8.6% of world output, and Russia is eighth at 3.9% of world output.
 |
| Fig. 187. Top World Producers of Copper Ore, 2021 |
But neither China nor Russia features among the top exporters of copper ore.
 |
| Fig. 188. Exporters of Copper Ore, 2020 |
 |
| Fig. 189. Importers of Copper Ore, 2020 |
 |
| Fig. 190. Top World Producers of Metallic Copper, 2021 |
 |
| Fig. 191. Exporters of Copper, 2018 |
One can also see China and Russia's importance in copper refining in the world exports of copper wire and copper pipes, two very important end uses of copper.
 |
| Fig. 192. Exporters of Copper Pipes, 2020 |
 |
| Fig. 193. Exporters of Copper Wire, 2020 |
China produces almost 85% of the world output of magnesium metal. Russia is second in the world at 6.3%. Magnesium is mainly used in the automotive industry and aircraft industry as alloys. The US is import-dependent up to 50% for its magnesium needs.
 |
| Fig. 194. Top World Producers of Magnesium, 2021 |
The export chart looks different than the production chart for magnesium, in that Russia is not as significant an exporter as a producer, but China is still a major exporter.
 |
| Fig. 195. Exporters of Magnesium, 2020 |
Magnesium, is a crucial metal that most of the world imports, as the chart below shows.
 |
| Fig. 196. Importers of Magnesium, 2020 |
Nickel is mainly used in the production of stainless steel (68% of global production) and alloy steels. It is also a very important catalyst in the chemical industry in the form of organo-nickel complexes as well as in nickel-aluminium alloys (Raney nickel). Nickel is also a key component in rechargeable batteries. Nickel mesh is used in fuel cells. Russia is the third-largest producer of nickel ore, producing 9.1% of global output. The US is 48% import-dependent for its nickel needs, as of 2021.
 |
| Fig. 197. Top World Producers of Nickel, 2021 |
A slightly different picture is seen from the exports of finished nickel as well as from the exports of nickel ore.
 |
| Fig. 198. Exporters of Nickel, 2018 |
 |
| Fig. 199. Exporters of Nickel Ore, 2020 |
The Philippines are the top exporters of nickel ore, but Russia is the world's top exporter of finished nickel, at 16.4% of global exports. This again points to the complex nature of supply and value chains in the world. One cannot do without the raw material; but likewise, one cannot do without the refiner; and one cannot do without the entity that produces the final product.
There is an extra complication with nickel. One of the important steps in the refining of nickel ore is the conversion of the ore into a form called nickel matte, or nickel sulfide. Many countries convert nickel ore (either their own mined or or imported ore) into matte, and then convert it to nickel or export the matte. The graph below shows the importers of nickel ore.
 |
| Fig. 200. Importers of Nickel Ore, 2020 |
The next graph shows the exporters of nickel matte.
 |
| Fig. 201. Exporters of Nickel Matte, 2020 |
The nickel matte then gets refined into pure nickel. The next graph shows the top importers of nickel matte.
 |
| Fig. 202. Importers of Nickel Matte, 2020 |
So what we see is that some countries export nickel ore and some process the ore and export the matte. Indonesia is the top producer of nickel ore, followed by the Philippines, Russia, New Caledonia, and Australia. But the top exporters of nickel ore, in descending order, are the Philippines, New Caledonia, Australia, Zimbabwe, Indonesia, Finland, and Canada. The top exporters of nickel matte, in descending order, are Canada, Russia, Indonesia, Finland, Philippines, Papua New Guinea, and New Caledonia. Russia, Canada, and Indonesia export a lot more matte than they do the ore. Australia and New Caledonia export a lot more ore than matte.
From the chart on nickel exporters, we see that, in addition to the main exporters of nickel ore, certain countries that do not produce nickel ore are important exporters of nickel. Some examples are the UK, Norway, China, Japan, and South Africa. How is this possible? It is understandable when we look at the chart of importers of matte and ore. China imports more than 63% of global ore exported and nearly 22% of total nickel matte exported. But it only exports a small amount of nickel. That means it is using most of it internally. South Africa and Finland are major importers of nickel ore, and Japan, the UK, and Norway are major importers of nickel matte.
If economic sanctions are applied against Russia, the world might suddenly see nickel vanishing from world markets because Russian nickel might be off limits. That will mean that all industries that are downstream will not get raw nickel for their needs, for example, rechargeable nickel hydride batteries. Even if nickel is exempt by the West from sanctions, Russia might decide to impose sanctions on the export of nickel, seriously crippling Western industry. Economic sanctions are a blunt instrument and hence a very foolish idea, and it is hard to believe that any economist would support such self-destructive ideas.
Sulfur is mainly used to produce sulfuric acid, which is a very important bulk chemical in the chemical and fertilizer industry, to produce, among other things, ammonium sulfate. About 60% of sulfuric acid is used for fertilizer production. Russia is the third-largest producer of sulfur in the world (9.4%), after China (21.3%) and the USA (10.2%). One could say that, with a huge population, a large percentage of China's sulfur production is used for domestic needs. While this is undoubtedly true, the manufacturing volumes still give a sense of China's independence from the West. In the event of a total break with the West, China will be reasonably self-sufficient in sulfuric acid.
 |
| Fig. 203. Top World Producers of Sulfur, 2021 |
That most of the sulfur produced in China is used up in domestic consumption is clear from the next graph, which shows the global exports of sulfur, where China makes up just 1.6% of global exports. The USA also does not feature in the list of top exporters, despite being the second-largest producer of sulfur. Russia forms only 2.4% of global exports, indicating that it, too, is using most of the sulfur it producer for internal consumption.
 |
| Fig. 204. Exporters of Sulfur, 2020 |
However, in further evidence of the difficulty of tracing commodities, China also uses a lot of its sulfur to produce ammonium sulfate, one of the important fertilizers, and is one of the leading exporters of ammonium sulfate.
 |
| Fig. 205. Exporters of Ammonium Sulfate, 2020 |
Titanium is a metal that gives a lot of strength to other metals in alloys. So it is used in aircraft bodies because it provides high strength with low weight. Titanium dioxide is also used in the paint industry because it provides a brilliant white colour. China is the top producer of titanium in the world, producing 57.9% of total output; Russia is third at 13% of world output. Together, the two countries produce 71% of world output.
 |
| Fig. 206. Top World Producers of Titanium, 2021 |
Russia and China are also two of the top exporters of titanium, as the chart below shows, totaling to more than 20% of world exporters. The US is the leading exporter of titanium in the world, at 31%.
 |
| Fig. 207. Exporters of Titanium, 2020 |
A look at who imports Russian titanium is seen in the graph below. It can be seen that European countries spend $259 million, buying 55% of Russia's total exports of titanium. The US buys $132 million worth of Russian titanium.
 |
| Fig. 208. Importers of Titanium from Russia, 2020 |
Vanadium is mainly used in high-strength alloys with iron and steel; but another important use (in smaller quantities) is the use of vanadium pentoxide, which is the crucial catalyst used in the manufacture of sulfuric acid. China produces two-thirds of the world output, and Russia produces 17.6%. The US is completely dependent on imports for its vanadium needs. In 2021, the world produced 110,000 tons of vanadium.
 |
| Fig. 209. Top World Producers of Vanadium, 2021 |
Tellurium is used to make cadmium telluride, which is used to make thin-film solar cells. It is also used to make bismuth telluride, which is used in thermoelectric devices for both cooling and energy generation. It is also used in alloying because it provides malleability to alloys and makes machining easier. China is the world leader, at nearly 60% of world output; Russia is third, at more than 10%.
 |
| Fig. 210. Top World Producers of Tellurium, 2021 |
Cobalt is used to make extremely hard and durable alloys, and for this reason a major use of cobalt is in the manufacture of aircraft gas turbines. It is also used to make wear-resistant machinery. Cobalt compounds are also very important catalysts, especially as organometallic complexes in the chemical industry. The US is 76% import-dependent for cobalt. Congo is the world leader in cobalt production, at more than 72% of world output; Russia is second, at 4.6%. One reason why Russia’s position is very important is that Congo has always been unstable politicially, and therefore supplies from the Congo may not always be guaranteed.
 |
| Fig. 211. Top World Producers of Cobalt, 2021 |
Germanium is an extremely important mineral that is a vital part of the new economy – it is used to make semiconductors, to make solar cells, and for fiber optics (as germanium tetrachloride). China produces 67.9% of the world’s supply of germanium; Russia is a distant second, at 3.6%. The US is more than 50% import-dependent for Germanium.
 |
| Fig. 212. Top World Producers of Germanium, 2021 |
Tungsten is used to make wear-resistant tools and machinery, such as the drilling bits used by the oil drilling industry. It is also used as tungsten wires in light bulbs and heating equipment. China produces 83.3% of the world’s tungsten, followed by Vietnam at 5.7% and Russia at 3%. Together, 92% of the world’s tungsten is made by these three nations. The US is more than 50% dependent on imports of tungsten for its needs.
 |
| Fig. 213. Top World Producers of Tungsten, 2021 |
Russia is also one of the leading producer of the platinum group of metals, which comprises platinum, palladium, rhodium, ruthenium, iridium, and osmium. The main use of the platinum group of metals is in catalytic converters in internal combustion engine cars. These are used to reduce emissions from automotive engines, and are present in every conventional car, whether it be a gasoline or a diesel car. Platinum group metals are also used as catalysts in bulk chemical processes, such as petrochemical processes. The two most important platinum group metals are platinum and palladium.
 |
| Fig. 214. Top World Producers of Palladium, 2021 |
 |
| Fig. 215. Top World Producers of Platinum, 2021 |
Russia also produces 10.5% of the world’s antimony, second after China at 71.5%; but it has 23.3% of total world reserves. Russia is the leading producer of asbestos in the world, producing 59% of the total asbestos; it also has the largest known reserves of asbestos in the world. Russia is also the top producer of natural diamonds in the world, contributing to 30% of total global production, and has 54% of total known reserves. It is fourth in the world in the production of arsenic, at 4.3%, and produces 4.6% of the world’s cadmium. Russia and Canada are the leading producers of gemstones, at 23% of total global production each. It has the third-largest reserves of peat in the world, at 8.3%, behind Finland at 50% and its close ally and neighbor, Belarus, at 21.7% — and thus, the Russia-Belarus total is 30% of world reserves. Russia also has the second-largest reserves of rhenium, a very important catalyst material in the chemical industry, at 12.9%, behind Chile, at 54%. These are not exhaustive lists, but give some idea of the mineral wealth in these regions.
Russia is also one of the leading exporters of industrial diamonds, as can be seen in the graph below.
 |
| Fig. 216. Exporters of Industrial Diamonds, 2018 |
As can be seen, the minerals that Russia has in abundance, along with China, are extremely important. If this economic war ever gets more intense and Russia and China were to stop selling these minerals to the West, things could go really wrong for Western economies. This is why imposing an embargo on Russia is not practical.
Back to TOC
The Chinese Domination of the Commodity Market
We already saw several commodities in the previous section in which China was a dominant player, along with Russia. Let us look at a few more minerals, in which Russia is not significant, but China is dominant. As already discussed, this is very important in the context of the “no limits” partnership between Russia and China.
Alumina and Bauxite are the two main ores of aluminium. Earlier, we had seen the production of finished aluminium. But this is the production of aluminium ore. China is the world leader by far in the production of alumina and second in the world in the production of bauxite. This is particularly important in the context of the announcement on March 20, 2022, by the Australian government that it is banning all exports of alumina and bauxite to Russia. With its “no limits” friend ready to supply as much as it needs, Russia need not worry about Australia’s decision.
 |
| Fig. 217. Top World Producers of Bauxite, 2021 |
 |
| Fig. 218. Top World Producers of Alumina, 2021 |
I was not able to get data on alumina and bauxite exports.
Another extremely important metal in the world is lead, which is used in all lead-acid batteries in cars around the world. The graph below shows the leading producers of lead in the world.
 |
| Fig. 219. Top World Producers of Lead, 2021 |
China produces nearly half the lead in the world. This means that the rest of the world is highly dependent on lead from China to run their cars.
China is also the world leader in the production of “rare earths,” an umbrella term covering 17 elements in the periodic table of elements, called the “lanthanides.” Despite the name, the “rare earths” are quite abundant; however, China has the majority of the world's deposits. The rare earths have a number of highly specialized properties. In particular, many of them, such as praseodymium and neodymium, are extremely useful as magnets. The most powerful magnets in the world are made of rare earth minerals. A quarter of all rare earth minerals are used as magnets. In this context, the exports of permanent magnets is significant, as can be seen from the graph below. China dominates the export market for permanent magnets.
 |
| Fig. 220. Exporters of Permanent Magnets, 2020 |
Most mobile phones have rare earth elements in them. Another quarter of the total rare earths mined find use as catalysts in chemical processes – for example, in petroleum refining. These are extremely useful industrial minerals. Some are used in the production of nickel-metal-hydride batteries and in fuel cells. Others are used in making LCD displays, plasma screens, fibre optics, lasers, and medical imaging equipment. Thus, rare earths are extremely important for renewable energies, such as wind, solar, and batteries.
 |
| Fig. 221. Top World Producers of Rare Earths, 2021 |
China is also the world’s leading producer of elemental silicon by far, producing 70.3% of global silicon production. It should be noted that silicon is abundant in the earth, because all sand is essentially silica, or silicon dioxide; but it is China that makes the most silicon from silica. Russia is second in silicon production, at 6.8%. About 80% of this elemental silicon is used as an alloy with iron, called ferrosilicon, because it improves the properties of iron. The remaining 20% is refined to 95-99% purity, and is called “metallurgical grade” silicon. The majority of metallurgical grade silicon is used in aluminium alloys (known as silumin alloys) for high-end automotive applications with cast aluminium parts. About 15% of metallurgical silicon is further purified to “nine-9” purity, or 99.9999999%, for semiconductor applications, since the majority of semiconductor chips are made of silicon.
 |
| Fig. 222. Top World Producers of Silicon, 2021 |
This can also be seen in the exports of elemental silicon. China exports 40% of the elemental silicon (not semiconductor grade) in the world. Other countries import this and further refine it to nine-9 purity for semiconductor applications.
 |
| Fig. 223. Exporters of Silicon, 2020 |
China is the world’s leading producer of fluorspar, or calcium fluoride, an incredibly important bulk chemical, producing 63% of world output. Fluorspar is used to make hydrofluoric acid (HF), which is then used for a variety of uses, including making
- Refrigerants, such as Freon
- Teflon, the basis for all nonstick pans
- Etchants, to clean semiconductor chips. HF can etch glass, and is one of the most powerful acids.
- In preparing strong acid catalysts by exposing resin beads to it. These strong acid resins are extremely useful in the petrochemical industry
- Pharmaceuticals, such as Fluoxetine (Prozac)
- Inorganic fluorides, such as sodium aluminium fluoride, or cryolite, used in the production of aluminium by electrolysis; and uranium hexaflouride.
 |
| Fig. 224. Top World Producers of Fluorspar, 2021 |
China produces 30% of the world output of tin, a huge bulk chemical. About half of tin production is used in the manufacture of solder, a tin-lead mixture used for joining wires in electrical circuits. Another huge use of tin is the coating of steel by tin to prevent corrosion. Copper vessels are also coated with tin to prevent toxicity. A niobium-tin alloy is commonly used to make superconducting magnets. Tin oxides are used in optoelectronics such as LCD displays. Tin is also used in advanced Lithium-ion batteries as a negative electrode.
 |
| Fig. 225. Top World Producers of Tin, 2021 |
China is one of the world leaders in the production of lithium, one of the most important minerals today. Lithium is used to make batteries for electric cars, phones, laptops, and a variety of other electronics. Lithium oxide is also used as a flux for reducing the melting point of silica in glass manufacture. Lithium is also a very important drug in psychiatry, being the frontline drug to treat manic-depressive illness.
 |
| Fig. 226. Top World Producers of Lithium, 2021 |
This is also seen in the exports of lithium carbonate, the main ore of lithium. The main application of lithium today is batteries, and it can be seen that China is the world leader in the production of lithium-based batteries.
 |
| Fig. 227. Exporters of Lithium Carbonate, 2020 |
 |
| Fig. 228. Exporters of Lithium Cells and Batteries, 2020 |
China produces 72% of the world output of lime, one of the most important bulk inorganic chemicals. Lime is used in steelmaking; in chemical processes such as the manufacture of fertilizer, glass, paper and pulp, calcium carbonate, and sugar refining; in flue gas desulfurization; and construction.
 |
| Fig. 229. Top World Producers of Lime, 2021 |
Another extremely important bulk mineral is graphite. Graphite is used for a variety of uses, including producing refractory bricks for furnaces to insulate them – these are used in every part of a steel factory to hold molten metal, including the blast furnace itself. China produces 75% of the world’s refractories. According to the USGS, in 2021, one million tons of natural graphite were mined, with 79% of them coming from China.
 |
| Fig. 230. Top World Producers of Natural Graphite, 2021 |
Graphite is also used as the anode in all rechargeable batteries such as Lithium-ion and Lithium-metal-hydride batteries. A single electric car might contain 40 kg of graphite in the battery.
Graphite is also used in steelmaking to increase the carbon content of the steel. Graphite is also ubiquitous in all electrical motors, because they use carbon brushes which are made of graphite.
Another large-scale use of graphite is in automotive brake shoes. The use of graphite has zoomed since the banning of asbestos for brake linings.
Graphite is also widely used in the casting industry as a lubricant to line the mold and easily remove the cast part. It is also used widely in headphones and the ubiquitous pencils.
China's dominance of world production of graphite is also seen in the graph below, of world exports of graphite.
 |
| Fig. 231. Exporters of Graphite, 2020 |
The US is 100% dependent on imports for its graphite needs.
Another important mineral that the world is crucially dependent on China for is gallium, which is one of the most important semiconductor materials. China produces more than 95% of the world’s supply of gallium. The reason why China is such a dominant supplier of gallium is that gallium always occurs along with aluminium (they are part of the same family of elements in the periodic table). Since China has huge reserves of alumina and bauxite, it produces gallium as a byproduct of the aluminum industry.
 |
| Fig. 232. Top World Producers of Gallium, 2021 |
Gallium is extremely important in electronics. 98% of all gallium produced is used to make semiconductors, mainly as gallium arsenide and gallium nitride. Around two-thirds of semiconductor gallium is used in creating high-tech integrated circuits, such as ultra-high-speed logic chips. All modern 3G and 4G smartphones use gallium arsenide chips. Around 20% of gallium produced is used in the manufacture of optoelectronics devices, an $18.5 billion market in 2016. The US is 100% reliant on imports for its gallium requirements.
Another important metal that China is a significant producer of is manganese. China produces 6.5% of the total world output of manganese, as can be seen from the graph below.
 |
| Fig. 233. Top World Producers of Manganese, 2021 |
Manganese is an extremely important metal in metallurgy, especially in the production of steel, where it is added as a scavenging metal to remove excess sulfur, dissolved oxygen, and phosphorous, and to improve the malleability of steel. About 90% of global manganese output is used for this crucial role in steel production, and there is no other mineral that can substitute for manganese in this role. Steel containing between 8% and 15% manganese is known for its high tensile strength, and is used by the British and US military to make helmets for soldiers. Manganese is also an essential component of stainless steel.
Despite the fact that China is only the fourth largest producer of manganese, it is the world's largest exporter of manganese, as can be seen in the graph below.
 |
| Fig. 234. Exporters of Manganese, 2020 |
I will close this section (which is not exhaustive) with molybdenum, a metal that is primarily used to make alloys. Molybdenum is an essential constituent of stainless steel, comprising anywhere from 0-4%, depending on the type of stainless steel. Molybdenum provides high strength and hardness in alloys, and is also highly temperature-resistant, making it an indispensable ingredient of high-performance alloys known as superalloys. These are used in extreme environments such as aircraft gas turbines, high-speed drill bits, and tools. It also increases corrosion resistance in alloys. China is the world's biggest producer of molybdenum, and produces 44% of the world’s annual supply. The exports of molybdenum also show China to be the top exporter of this mineral, at 24% of world supply.
 |
| Fig. 235. Top World Producers of Molybdenum, 2021 |
 |
| Fig. 236. Exporters of Molybdenum, 2020 |
The Infeasibility of Economic Sanctions Against Both Russia and China
To recapitulate some of the problems facing the West: The current sanctions against Russia do not seem to be working, and China has not joined the sanctions against Russia, along with most Asian and African countries, which is making European sanctions on Russia toothless. Things could get a lot worse if Russia decides to flex its commodity muscles and stop supply of several key minerals to the West.
Europe, a raw materials pauper, imports more than $7 billion of metals, rubber, and minerals a year from Russia, including nickel, palladium, lithium, platinum, cobalt, neon gas, aluminum, and copper. These are all vitally important for the batteries, electric cars, solar panels, smart grids, and wind turbines needed to tackle climate change. For example, Norilsk Nickel — owned by Vladimir Potanin, a key Putin ally and one of Russia’s original oligarchs — is the world’s largest producer of high-grade nickel, mined in Siberia, and also trades in palladium, cobalt, and copper. Russia supplies Germany with 39 percent of its nickel — which is used in car batteries — and much of that comes from Norilsk Nickel.
“This degree of dependency on [Russia for] some materials is really quite alarming,” says Vasileios Rizos, head of sustainable resources circular economy at the Center for European Policy Studies, a think tank based in Brussels. “It has accelerated a search already underway to diversify and replace Europe’s sources for these raw materials. In no way is it sustainable in the long run, with Putin or without.”
Another example of the dependence that the West has on Russia is manifested by the semiconductor tussle. Europe and the US have decided that they will not allow Russia to buy advanced semiconductors from Western companies, including Japanese, Korean, and Taiwanese companies. But this can cut both ways, because a vital ingredient that is needed to make semiconductors is neon gas. More than half the world’s neon supply is made by a collaborative Russian-Ukrainian venture that is now in shambles: the neon is produced as a byproduct of Russia’s steel industry and then purified in Ukraine. If Russia decides to ban the export of its neon gas (something that will have minimal revenue implications for it), it can completely stall semiconductor manufacturing worldwide.
One of the things that should be clear from all this is the close connection between Russia and China. Russia can never be punished economically as long as China is a close economic ally for it. So the only way for the West to be able to punish Russia is to make China an ally. But the West has made China its enemy number one. Recently, the Biden administration put in place new restrictions that greatly hamper the Chinese semiconductor industry. Why would the Chinese cooperate with the West and act against Russia? One example highlights the dangers of fighting wars everywhere. In March, the West imposed sanctions on Russia’s ability to procure semiconductors anywhere in the world. One of their targets was China, because China is the largest exporter of semiconductors to Russia. As this article from March 2022 explains,
Russia imported $439.84mn worth of diodes, transistors and other semiconductor devices in 2020, along with $1.25bn of electronic integrated circuits (IC), customs data from the United Nations Comtrade database show. That was a fraction of the $440.4bn in global semiconductor sales in 2020, which rose to $555.9bn in 2021, according to the World Semiconductor Trade Statistics (WSTS) organisation.
Around a quarter of Russia's semiconductor imports are subject to the sanctions, equivalent to $470mn, the ministry of economic development said over the weekend of February 26-27, adding that the country would look to Asia-Pacific countries to fill the supply shortfall.
China supplies the majority of Russian imports of semiconductors and consumer electronics devices. Russia imported $248.57mn of the $439.84mn in components from China in 2020, as well as $246.34mn of the $1.25bn in ICs. The US was its second-largest supplier, accounting for a combined $64.6mn, the data show. Other suppliers include Japan, South Korea, Malaysia and the Philippines.
Chinese foreign ministry spokesperson Wang Wenbin said on March 1 that China remained opposed to the sanctions and would “continue to carry out normal trade co-operation” with Russia. But Chinese companies with a presence in Europe and the US could face large fines and other penalties. Under the US sanctions, any goods produced outside the US that use US equipment, software or blueprints are prohibited from being exported to Russia.
But Biden’s latest round of sanctions on China means that China need not worry about being punished by the West for helping Russia any longer. China is going to be punished anyway, whether or not it helps Russia, so it might as well go full tilt in helping Russia to try to defeat the US. This is the kind of destructive, non-cooperative, “My Way or the Highway” thinking that is operative in Washington, where the establishment still is deluded and believes that the US is a superpower that can get away with anything, and this kind of thinking will be the cause of its eventual downfall. This is the same reason why the US is having so much trouble with North Korea. China is the only country with any influence on North Korea, and attempts to treat China as an enemy will only make the West and, particularly, South Korea, more insecure.
The problem with the US is that it is trying to fight wars everywhere. At a time when it needed the support of the Chinese with regard to Ukraine, the US allowed Nancy Pelosi to visit Taiwan, greatly annoying the Chinese. They can now be sure that the Chinese will do everything in their power to help Putin. The Americans want to fight Russia, China, Iran, Cuba, Venezuela, North Korea, Afghanistan, and even Saudi Arabia, which was once a close ally of the US, all at the same time. They cannot expect any cooperation from other countries if they are trying all the time to establish a Pax Americana. And it does not work anyway. The world has changed.
If the US continues to annoy China, China might make a clean break with the West, invade Taiwan to secure its semiconductor supply, and stop supplying so many of the critical minerals that it has been supplying to the West. This would completely cripple Western industry. So the US needs to be very careful with its sanctions regime as regards China and Russia. Things could get a whole lot worse.
We have seen the kinds of problems that Europe is facing and will continue to face as a result of the sanctions they chose to impose on Russia in retaliation for its invasion of Ukraine. While there are too many facets to consider here, given the breadth of Russia’s influence on Europe and the world, let us look at one narrow area, viz., energy, because that is the area where most of the media attention has gone. What are Europe’s options with regard to the giant energy deficiencies facing it as a result of its sanctions on Russia?
Key Takeaways from Chapter V
-
Because of sustained high natural gas prices in Europe, several industries are on the brink of collapse in Europe because they use gas for heat
- Chemicals, Glass, Paper, Fertilizer, Cement, etc.
- This may move production permanently to other global locations, like the US or China
-
High gas prices did not start with the war in Ukraine
- They have been high for more than a year because of post-Covid demand
- The gas crunch from the Ukraine war came on top of a pre-existing gas crisis
-
The real gas crisis is not the high price of spot gas, but the loss of a low-price contract with Russia for gas
- Russian contract gas was priced at €15/MWh, whereas spot gas price was 6-7 times as high and went as high as 20 times during the peak
-
Spot gas prices have recently gone down due to two reasons
- Low gas demand from China has mitigated the situation
- Industry shutdown has caused demand in Europe to drop and lowered spot gas prices
- But it is still much higher than the old contract rates
-
Gas prices have domino effects because gas is also used as a feedstock
-
Ammonia is made from gas
- 70% of ammonia production is shut down
-
Carbon dioxide is a by-product of ammonia production
- Carbon dioxide shortage is causing problems for food preservation, beer and soft drink production, decaffeination of coffee, and humane killing of animals
-
Fertilizer is made from ammonia
- Fertilizer production in Europe has plummeted
- In addition, Russia and Ukraine are major global fertilizer producers, causing a supply crisis
-
China stopped export of fertilizer for domestic consumption
- Fertilizer shortage will cause a food crisis in Europe
-
Ammonia is made from gas
-
Europe is planning an oil price cap on Russian oil to be implemented on December 5, 2022
-
Russia has said it will stop supplying crude oil
-
This will drastically affect transportation within Europe
- Prevent goods from reaching plants from ports
- Prevent goods from reaching markets
- Prevent people from commuting to factories
-
This will affect the production of all plastic and polymer in Europe
- Affect production and cause shortages of containers, paints, adhesives, tapes, spectacles, clothes, jackets, automotive parts, applicances, toys, packaging, wire sheaths, food packaging, etc.
- Can cause loss of $109 billion to Europe’s chemical companies
- Force European governments to spend more on importing essential plastic items
-
This will drastically affect transportation within Europe
-
Russia has said it will stop supplying crude oil
-
Commodity crisis and shortages in Europe because of commodities supplied by Russia
- Wheat (18.8% of global output)
- Sunflower oil (20.5%)
- Ammonia (23%)
- Urea (14%)
- Processed Phosphates (10%)
- Potash Fertilizers (21%)
- Potash Fertilizers (21%)
- Aluminum for car and airplane bodies, appliances, machinery (5.4%)
- Magnesium for automotive and aircraft alloys (6.3%)
- Nickel for stainless steelmaking, rechargeable batteries, and chemical catalysts (9.1%)
- Sulfur for sulfuric acid, used for chemical and fertilizer production (9.4%)
- Titanium for aircraft body alloys (13%)
- Vanadium for high-strength alloys and catalysts (17.6%)
- Tellurium for solar cells (12.1%)
- Cobalt for gas turbines , wear-resistant tools, and chemical catalysts (4.6%)
- Germanium for semiconductors, solar cells, and fibre optics (3.6%)
- Tungsten for wear-resistant hardware (3%)
- Neon gas for semiconductor manufacture (50%-70%)
- Platinum (10.6%) and palladium (36.9%) for catalytic converters
-
US efforts to simultaneously treat China and Russia as adversaries is pushing China and Russia together and defeating American attempts to contain either of them
- China has even more influence on world commodity prices
-
Along with Russia, China can choke the supply of vital minerals to the West if the West goes too far in its sanctions on either
- Aluminium Metal (57.4% of world production)
- Magnesium (84.5%)
- Sulfur (21.3%)
- Titanium (57.9%)
- Vanadium (67.7%)
- Tellurium (58.5%)
- Germanium (67.9%)
- Tungsten (83.3%)
- Molybdenum (43.8%)
- Rare Earths (60.6%)
- Tin (30%)
- Silicon (70.3%)
- Lithium (13.4%)
- Lime (72%)
- Lead (46.6%)
- Graphite (79%)
- Fluorspar (63%)
- Bauxite (22.1%)
- Alumina (53.5%)
- Gallium (95%)
- The scarcity of oil and gas, combined with the scarcity of commodities, will lead to the De-Industrialization of Europe in short order
CHAPTER VI. EUROPE’S ENERGY OPTIONS
Europe’s Gas Storage Tanks
One of the common refrains regarding the crippling shortages of gas in Europe is that Europe is well-prepared for it, because their storage tanks for natural gas are now more than 90% full. But there is nothing for Europeans to feel happy about this, for the following reason.
Once a gas well is opened, it will keep releasing gas at a constant rate. The rate of extraction cannot be changed seasonally. Gas producing countries know this, and so, before they even drill a gas well, they make sure they have committed customers with long-term contracts who will buy the gas that starts flowing out at high pressure once the well is opened. This is because gas cannot be stored by gas-producing countries beyond a point, and if they cannot sell the gas, they have to burn (flare) it, which is a waste of a precious resource.
The countries that buy gas also know this. Cold countries need gas in the winter to heat their homes, in addition to needing gas year-round for industrial purposes. So they purchase a constant average quantity of gas every month. This amount is more than what is needed during the warm summer months and less than what is needed during the cold winter months. So the excess gas that they get in the summer is stored in tanks. In winter, the regular supply of gas (which is inadequate for winter conditions) is augmented by the stored gas in the tanks. So gas storage tanks are not an emergency supply or a reserve measure. They are needed for normal gas supply throughout the year.
This is what has been done in Europe every year. For Europe to get through a normal winter with its industry running and its citizens warm, that 90% is the level the tanks should be now, along with a continuous resupply of gas from Nord Stream.
The resupply was stopped by Russia some time back when it shut down Nord Stream, citing technical issues. Nord Stream 2 had never started pumping gas to Germany, but the pipeline was ready to start operation any day — until it was blown up. Now there is no chance of the supply resuming through Nord Stream any time soon, even if a peace agreement is reached soon, because of how extensive the damage has been.
The tweet below by Robin Brooks of the IIF captures this point well. He tweeted this in July, when Russia was still supplying 20% of the capacity through the Nord Stream pipeline. Since then, things have become much more dire, because Brooks talked about things then assuming things would continue at 20%. Now they are at 0%.
 |
| Fig. 237. Why It is Not Enough to Have Full Gas Tanks Without Supply |
So the level of gas storage in Germany’s tanks is irrelevant.
LNG to the Rescue?
The big problem with gas has always been that to transport large quantities of it, you need a pipeline, and building a pipeline is expensive and takes years. Since Europe is getting no gas from Russian pipelines, their only option is to use liquefied natural gas, or LNG. This can be transported by transoceanic tankers. Potentially, then, one option for Europe is to get LNG from Qatar or the UAE or the US or Algeria or Nigeria. There is nothing fundamentally wrong with this idea — countries like Spain have been doing this for a long time because of their proximity to Africa and the big oil producers on the African continent (Algeria and Nigeria) as well as Qatar in the Persian Gulf.
There are two potential problems with this solution. One is, as has already been discussed, that to make up so much lost Russian gas through LNG would require gas producers to ramp up gas production very rapidly, and that has historically not been possible. The second is that receiving LNG tankers and transporting LNG requires infrastructure that Europe, by and large, does not have. Let us discuss the second problem first and then come back to the first.
Ever since the Nord Stream pipelines were commissioned in 2012, Europe has not needed to have a large LNG infrastructure. Some countries on the coasts, such as Spain and Lithuania, have built the infrastructure so that they can receive LNG from across the seas. For Spain, this was a no-brainer because of its proximity to Africa and the big oil producers of Africa, Algeria and Nigeria. For Lithuania, LNG terminals meant that they could get gas from Norway and from the UK. But Germany, notably, does not have the infrastructure for receiving LNG. The figure below shows the existing LNG terminals in Europe as well as those that are planned and under construction.
 |
| Fig. 238. Existing LNG Terminals in Europe, New Proposed Ones, and Terminals Under Construction |
Even Lithuania’s and Spain’s LNG terminal infrastructure is not adequate for their needs; they will probably need to build more to completely do away with their need for Russian gas. Although the figure above indicates that several LNG terminals are planned, it should be noted that it takes about five years for an LNG terminal to be constructed. These are highly complex engineering projects.
However, the good news is that there is some room for Europe’s terminals to accept more LNG. Historically, the utilization of these terminals has been rather low, as can be seen in the following figure, although it was close to 100% in 2022.
 |
| Fig. 239. Utilization Rate of LNG Terminals in Europe, Pre-War |
Germany has announced the construction of an LNG terminal in Brunsbüttel in the north of Germany. However, this will only be operational in 2026 at the earliest, and is expected to have a capacity of 8-10 bcm.
For the short term, Germany is investing in what are known as FSRUs – for Floating Storage and Regasification Units. The German government plans to lease these units from manufacturers. But the bad news is that there are only 50 of these available worldwide, and so competition in these times is tough. Nevertheless, the German government has announced that it will lease and install five of these FSRUs, each with a capacity of about 5 bcm, in four locations on Germany’s coasts.
One of them is in Brunsbüttel, and is expected to start operation in early 2023 with an initial capacity of 3.5 bcm, gradually ramping to 5 bcm as the pipeline infrastructure is fully built for the transport of the LNG. Another FSRU will also be installed in the deepwater port of Wilhemshaven, again with the same final capacity of 5 bcm, although Uniper’s website states the capacity to be 7.5 bcm. Wilhemshaven will also host another FSRU with a capacity of 5 bcm, and this will be operational by the third quarter of 2023. Two other FSRUs are planned at Stade and Lubmin, and both of these will be operational by the end of 2023 at the earliest. There are also plans for a private FSRU, owned by Deutsche ReGas, to be operational by the end of 2022 with a capacity of 4.5 bcm.
From these plans, it appears that Germany will have the capacity to import 17 bcm a year by the beginning of 2023, which is a third of what it was importing from Russia in 2020. Today’s demand may be higher than in the pandemic year of 2020, so these terminals might cover 25% of Germany’s annual demand. However, by the time these terminals are operational, half the winter of 2022-23 will already be over, and several industries would have completely shut down for good by then. Still, it would be a welcome addition to alleviate the human suffering in Germany, and perhaps be adequate to provide home heating for the people of Germany after two bitterly cold months.
But having the capacity to receive LNG is not enough. The world must have the capacity to supply the gas that Germany is short of. In September, US shale oil and gas producers said in no uncertain terms that they do not have the ability to ramp up production to help out Europe. German chancellor Olaf Scholz had visited Qatar and the UAE to ask for LNG supplies to Germany, but in October, Qatar made it clear that it cannot compensate for the volumes of gas that Russia had been supplying to Europe. Qatar also wants a long-term contract, of 20-25 years, to justify its investment in new wells to supply Germany, but Germany is committed to a green transition and is hesitant to sign such deals. Qatar has also made it clear that Germany cannot get short-term supplies by getting Qatar to ditch its existing Asian clients by outbidding them. As the CEO of the National Gas Company of Qatar, Saad al-Kaabi, said, “Qatar is absolutely committed to sanctity of contracts, so when we sign with an Asian buyer or European buyers, we stick to that agreement.”
Opinion is also unanimous that if Europe somehow survives this winter, it will face, literally, a struggle for survival next winter, if the war continues until then and if a peaceful resolution with Russia is not found on the issue of sanctions. The reason is that in 2022, Germany was able to use Russian gas via Nord Stream for a long time to fill its tanks before Russia first reduced supply to 20% of capacity and then 10%, and finally nothing at all. This allowed Germany to fill its storage tanks. Subsequently, Germany bought LNG on the spot market from China because China was experiencing weak demand due to Covid-related shutdowns. There will be no gas flowing from Russia in 2023, and it is unlikely that the downturn in China will last until next year. So Europe will likely go into the winter with zero storage next year.
An article in Turbomachinery magazine, a specialized trade magazine, explains why it is not so easy to increase production of gas in the US (or, for that matter, Qatar or the UAE) to supply more gas to Europe. The problem, as the authors explain, is that production capacities must be increased across the entire value chain. It isn’t just, as the authors put it, just a matter of opening a faucet. Since the article is in a magazine devoted to turbomachinery aspects, the authors focus on what is needed from the turbomachinery side. As the authors put it,
Unfortunately, the solution isn’t as simple as turning on a faucet and waiting for more LNG to come out. No gas production, transport, or LNG facilities exist with any meaningful excess capacity. Significant infrastructure investments are required in the very near future to increase LNG production in North America. That includes new plant facilities, as well as expansions and additions to existing facilities across the entire natural gas value stream, from wellhead to production plant.
On the receiving side, LNG terminals with regasification and compression must be constructed and tied into existing pipeline systems. Increased production requires not only additions to LNG production plants, but also increased natural gas production, gathering, treatment, transportation and regasification. Upping the amount of natural gas produced, most likely through fracking and new onshore/offshore drilling, calls for additional pipeline capacity, mostly through the addition of compression and pipe loops on existing lines. New gas liquefaction plants are another obvious need.
An increase of 20% in U.S.-exported LNG corresponds to an increase of 3% in U.S. natural gas production. That may not sound like much but becomes a staggering figure in the context of existing infrastructure and required new machinery. In the U.S. upstream sector — gas production and gathering — there are approximately 15,000 installed compressors, mostly smaller reciprocating compressors driven by engines or electric motors. In the midstream or gas transport sector, there are about 8,000 installed compressors, made up of a mix of older low-speed integral reciprocating, high-speed separable reciprocating, and gas turbine or electric motor-driven centrifugal compressors.
Ignoring downstream and LNG plants for now, there is an estimated 25 million horsepower in the upstream sector and 40 million horsepower in the midstream. Upping this by 3% requires another 2 million horsepower of new compression in the U.S. alone. Based on current worldwide manufacturing capacities, it would take about 2-3 years to meet this new demand for gas compressors. This doesn’t include lead times for material, transport, installation and commissioning/startup in an already resource-constrained economy. Since current lead times for compressor trains, valves and all major transport and production equipment are around 18-24 months between order and startup, it’s fair to estimate it would take the U.S. at least 3-5 years to ramp up LNG production to meet new European demands.
Regardless of actual lead times and manufacturing details, increasing U.S. LNG export capacity requires more than just production plants. It demands consideration of the entire natural gas supply chain. New gas infrastructure, including significant new compression, will be required from well-head to gas consumer to meet rising worldwide demands for LNG.
What these authors say about increasing LNG capacity could be said about every panacea that is being floated today as a solution to Europe’s energy woes. Whether it be solar or wind power or heat pumps or hydrogen, building the infrastructure all the way up the value chain takes time. If you are talking solar energy, it requires vast investment to produce as many solar panels as is required to replace the vast quantities of energy that are currently being provided by fossil fuels. There needs to be a sustained investment effort across all five stages of the value chain: polysilicon, ingot, wafer, cell, and module; as well as the electronics, the connectors, the inverters, the glass covers, the mechanical mounting, the solar tracking mechanism, and so on. It also requires a vast battery infrastructure and huge manufacturing and mining capacities for the minerals needed in those batteries, and being able to secure those value chains, such as the supply of silicon and lithium.
With wind energy, large investments are required in the composites needed to manufacture the turbine blades; the drivetrains in the nacelle, including the gearboxes, magnet generators, and electronics; the electric grid; and in energy storage.
It is possible to transition from fossil fuels to these alternatives; but it has to be a planned transition over several years because it takes time to build integrated capacities. It cannot be done overnight because of a sudden, unplanned crisis.
With cheap Russian gas, Europe was actually on the correct path towards a renewable future, because it takes years to build up capacity, and Europe was progressing very well on that front, as the gradual reduction of fossil fuel capacity and the increase in renewable energy generation over the past 20 years showed. But by suddenly trying to jettison Russian energy without a viable alternative in hand, Europe has embarked on a futile journey that risks complete economic ruin.
Key Takeaways from Chapter VI
- Europe’s gas storage tanks do not provide any insurance against gas shortages because they were always needed in addition to regular supply of pipeline gas
-
Europe does not have enough LNG receiving terminals to import sufficient LNG
- LNG terminals take a long time (about five years) to construct
- Germany is leasing and installing mobile FSRUs to receive gas
- Three of them are expected to be operational by early 2023
- They could receive a maximum total of 17 bcm of gas, or roughly a third to a fourth of what Germany was getting from Russia
-
But the world does not have enough LNG spare capacity to supply Europe
- US shale gas producers have said they cannot increase production to help Europe
- Qatar has also said that it cannot compensate for Russian gas
- Qatar wants Germany to sign a 20-year contract
-
Ramping up production with any technology, whether LNG or solar or wind, takes time
- Supply chain needs to be built up for the whole value chain
- This can take years
- There is no quick, short-term solution to Europe’s energy shortage
SUMMARY AND CONCLUSIONS
“Not One Step Backward!”
On 22 June, 1941, Adolf Hitler, then at the height of his power, made a fateful decision by invading Russia. His decision was predicated on the belief that “one kick at the door and the whole rotten structure will come crumbling down,” referring to the Soviet State. Hitler was, of course, wrong about the weakness of the Soviet state, as history informs us. The USSR was far stronger, far more resourceful, and far more resilient than what not only Hitler, but the whole Western world believed.
By the beginning of December, 1941, Hitler’s generals knew that they had made a grievous error. They realized that while the Soviet army was giving up very easily in the early battles, leading to the loss of about 2 million troops killed or captured, their resolve had stiffened and they were now fighting hard. The German army realized that they were not adequately equipped to fight a war in the brutal Russian winter. The winter of 1941-42 resulted in the deaths of more than a million German soldiers in the frozen wastes of Russia outside Moscow.
The prudent thing to do then would have been to consolidate Germany’s gains and abandon any plans to move deeper into the Soviet Union. But, having failed in his big gamble to take the USSR in a single summer campaign, Hitler, like Napoleon before him, believed that if he persisted long enough, he would prevail over the Soviets and total victory would eventually be his. He failed to defeat the USSR, and instead, Germany was totally destroyed. When his initial attack, the Blitzkrieg in June 1941, failed, he did not reconsider his original plan to conquer the USSR. He doubled down on his efforts, and perished.
The West is making mistakes of a similar nature. In March 2022, they unleashed what they truly believed to be a “nuclear option” in financial terms. They froze Russia’s funds, seizing more than $300 billion of its money, and blocked it from SWIFT, preventing it from buying anything using dollars or euros. Just like Hitler believed his military blitzkrieg would bring the Soviet Union to its knees in short order, the West believed that its financial blitzkrieg would bring Russia to its knees and force it to abandon its special military operation. US President Joe Biden even bragged about that possibility in a public speech on March 26, 2022. But that did not happen. Russians hardly felt much pain due to the West’s actions. Instead of reconsidering their course of action and starting negotiations with Russia, the West got into an ideological trap, just like Hitler did in 1941. When Hitler’s generals radioed him that the Soviets were overrunning their frostbitten troops and requested permission to withdraw, they got the one-line response: “Not one step backward!”
Today’s Western nations are being equally obstinate, and are saying that they will not take one step backward on their strategy to financially choke Russia — a strategy that has clearly failed and will continue to fail. In their ideological blindness, they don't even seem to have done a basic sanity check to find out if the measures they took and are now contemplating (such as the impending oil price cap) will truly deal a death blow to Russia’s finances.
The Sanity Check that Europe Should Have Done in March
This article is precisely the kind of sanity check that Europe should have done back in March before they went ahead with their ill-considered sanctions policy.
It has established clearly that:
- Russia’s economic fundamentals are strong enough to help them withstand any economic sanctions
- The countries of Asia and Africa will never support sanctions against Russia because of how dependent they are on Russia
- China will never let Russia lose either the economic or the military war because of how valuable Russia is to China’s developmental plans
- NATO will never enter the war directly
- Russia was better prepared to fight a proxy war (both military and economic) than Ukraine or the West
- Russia has a strong, technologically independent, modern, and advanced armaments industry that could continue to produce weapons to continue this war indefinitely, unlike the West
- Russia had already made its economy sanctions-proof after enduring eight years of sanctions after 2014
- Russia had been steadily dumping the dollar and US Treasury bonds since 2014, in order to free itself from Western financial control
- Russia enjoyed a trade surplus with Europe, which meant that if Europe decided to boycott Russia, it would lose far more than Russia would
-
Russia held a crucial advantage relative to Europe in that it had oil and gas that Europe desperately needed
- Not having these fuels would cripple Europe
- The countries of Asia can easily supply Russia with everything they were getting from Europe in exchange for oil
- But nobody other than Russia can supply Europe with the oil and gas Russia was providing them (at least in the short run, for a couple of years)
- The absence of Russian oil and gas will lead to the de-industrialization of Europe, because what Europe has is a supply problem of fuel, not a price problem
- The West cannot afford this supply crisis, so soon after the Covid crisis that had almost finished Western economies
- Oil- and gas-producing nations cannot increase production enough to save Europe from its energy crisis
- Most European nations are too dependent on Russia for energy to be able to sanction Russia without destroying themselves in the process
- The lack of oil and gas will lead to the de-industrialization of Europe by forcing the closures of industry and causing them to move operations wholesale to America or China
- Sanctioning Russia has led to the loss of cheap gas and oil at long-term contract rates, which are much lower than spot gas rates, and created an existential crisis for European industry
-
Oil and gas shortages have domino effects on economies, because they are used as feedstocks in the chemical industry
- Gas is used to make ammonia, which is used to make fertilizer, which is needed to make foodgrains, vegetables, and fruits
- The ammonia production process produces carbon dioxide, which is used in food preservation, beer and soft drink production, decaffeination of coffee, and humane killing of animals
- Oil is used to make plastics and polymers - containers, paints, adhesives, tapes, spectacles, clothes, jackets, automotive parts, applicances, toys, packaging, wire sheaths, food packaging, pens, electronics housings, laminates, etc.
- Without gas and oil, most consumer and industrial products in Europe cannot be manufactured
- Lack of oil and gas will cause losses of hundreds of billions of dollars to European chemical companies and likely cause them to close
- Lack of essential plastic items can further strain national budgets because they have to import them from outside the EU
-
If Russia (and China) decide to withhold supplies of other commodities in order to retaliate for Europe’s sanctions against them, the situation will be dire for the entire Western world, because of how China and Russia dominate the supply of so many essential commodities
- Wheat, sunflower oil, diamonds, fertilizer, aluminium, magnesium, nickel, sulfur, titanium, vanadium, tellurium, cobalt, germanium, gallium, tungsten, neon, rare earth minerals, platinum, palladium, lime, lead, tin, molybdenum, silicon, lithium, graphite, fluorspar, alumina, and many more
- Europe’s storage tanks do not provide any insurance against gas shortages
-
Europe does not have enough LNG terminals to import LNG to make up for the gas shortage
- Germany’s attempts to install temporary FSRUs for LNG will at most provide a quarter to a third of their gas requirements, starting in 2023
- The world does not have sufficient spare gas or oil capacity to supply Europe for the missing Russian oil and gas
- Renewables cannot be ramped up quickly enough to solve Europe’s energy crisis
- The US and Europe have needlessly alienated China at the same time it is trying to sanction Russia, thereby ensuring that the sanctions will have no significant effect on Russia while making both Russia and China more independent of the West
- The West’s unprecedented move to ban Russia from SWIFT and freeze its US dollar reserves will spark a global move in the non-Western world to de-dollarize
Where Do We Go From Here?
Things are extremely dire for Europe today. They have played their trump card (banning Russia from using SWIFT and seizing the assets of the Russian government and of Russian citizens worldwide) and failed to win the game. Things are just going from bad to worse. The winter is about to start, and Europe has giant shortages in oil and gas. Nord Stream has been blown up, and there is no way to start pumping gas through it tomorrow. Europe has banned coal imports from Russia (and they are 22% dependent on Russia for coal), they are not getting gas from Russia (they are 38% dependent on Russia for gas), and they are about to put in place a ban on December 5 that will result in no more oil flowing to Europe from Russia (and they are 28% dependent on Russia for their oil needs). There is no way in the short term (1-2 years) for Europe or even the medium term (5 years) to fill this giant hole in their energy requirements.
Europe is going to face an immediate catastrophe in a matter of weeks. Ukraine’s energy infrastructure has been destroyed by Russian missiles. Kiev says only 50% of the electricity grid is functioning. Much of Ukraine is dark. Without electricity, neither the water supply nor the sewage system will work. Most Ukrainians in cities live in high-rise apartments. With the bitter winter approaching, Ukrainians without heat, electricity, water, or sewage will start flooding Europe as refugees. Europe will be hit by a humanitarian catastrophe. No continent can handle tens of millions of refugees in a sudden wave. European economies, which are already on the brink, will be overwhelmed.
Europe continues to sanction Russia more and more, despite all evidence suggesting that these measures are not working. Russia’s response has been fairly measured so far. If it starts retaliating using its strength in commodities, things could get much worse for Europe.
Europe, the US, the UK, Canada and Oceania, along with Japan and South Korea (the “West”) have also been upset about China’s strong economic support for Europe. If the West feels that the only way to increase pressure on Russia would be to start sanctioning China, things will get much worse for the West because of China’s control of so many key commodities. Not only Europe, but the US, too, will come to a standstill without commodities from China. If the West decides to sanction China, it means that they have massively miscalculated on China, just as they have already miscalculated with Russia. Given the West’s track record, however, one should not rule it out, howsoever insane it sounds.
If Europe continues on their current path, they face widespread de-industrialization; mass unemployment; mass starvation; and deaths due to exposure from cold. This, in turn, could lead to mass emigration of the poorer Europeans from Europe, perhaps to North Africa. This article has shown how all this might happen by highlighting Europe’s enormous dependencies.
Europe has two choices. Either they understand that their gamble has failed, and that things are likely to get much worse unless they completely reverse direction on Russia, or they continue on the path to destruction.
How can Europe avoid the bleak future outlined above and go back to a path of prosperity?
The wise course of action for Europe would be
- To push for a settlement with Russia
- To agree to Russia’s terms regarding Ukraine
- To drop all sanctions
- To pay all outstanding dues to Moscow for past fuel purchases
- To release back to Russia all Russian assets consfiscated by European governments
- To return to Russian private citizens all assets (e.g., yachts) seized by European governments
- To agree that Ukraine should cede territory and agree to become a neutral state with a new, Moscow-approved leadership
- To ensure the removal of all NATO personnel and weapons from Ukraine, and allow Russian monitors and defence forces to remain in the country to ensure that the agreement is being adhered to
-
To agree to a joint investigation on the sabotage of the Nord Stream pipeline, involving the Russians in the investigating team, and agree to punish those involved
- If European entities, such as the UK, were involved in the sabotage, ensure that those countries pay reparations to Russia for the damage caused
- If non-European entities, such as the US, were involved, demand accountability from them, cut them off from ties with Europe, and impose sanctions on them
- Disband NATO and instead create a new security alliance for Europe including Russia and limit membership only to Europeans
Needless to say, this will involve a loss of face for Europe, but it might just save European economies from complete annihilation.
Of course, Europe doesn’t have to do this. I am merely saying that this would be the wise course of action.
And why is that? Because if Europe does all this, then Russia will
- Start pumping gas through the one Nord Stream line that they say is still intact
- Start working on repairs to the other Nord Stream lines, so that in a year or so, Europe will start to receive 110 bcm of gas from Russia via both Nord Stream lines
- Resume pumping gas through the Yamal, Brotherhood, and Turkstream lines
- Resume supplying oil to Europe in time for the coming winter
- Resume coal shipments to Europe
- Start shipping fertilizer, wheat, and sunflower oil to Europe
People will point out that Europe cannot decide for Ukraine. They cannot decide that Ukraine should part with its territory or stop fighting Russia. This is certainly true. That is Ukraine’s decision to make. But Europe can stop supporting Ukraine, and that will go a long way in influencing Ukraine’s decision to continue fighting. As things stand, about half of Ukraine’s energy infrastructure has been destroyed. Without massive aid from Europe, Ukraine will freeze to death and starve this winter. It is hard to know how Europe can even help Ukraine, given that they themselves are reeling under giant energy shortages. The weapons flowing to Ukraine, even American ones, that help Ukraine continue fighting, have to flow through Europe. If Europe refuses to allow British or American weapons to transit through them, Ukraine will not get any more weapons from the US or the UK. That will shorten the war and end Europe’s suffering as well as the suffering of Ukrainians.
To be sure, if Europe decides to do this, it will be a giant loss of face for them. Ukraine will accuse them of betrayal and of selling them out. Europe’s problem has been made harder by the daily dose of propaganda, for the last nine months, with journalists hyperventilating on every Western channel about “Russia’s unprovoked war on Ukraine” and the nonstop propaganda references to “Russia’s terrorism,” “Russian human rights violations,” and the like. Europe has painted itself into a corner, and European leaders will have a hard time explaining an about-face position.
And so, the only way for things to change in Europe, as things rapidly get worse for their citizens, is social unrest and instability as citizens reel from energy and food shortages in the coming brutal winter. There will be rioting on the streets and coups that remove the current leaders from power, because the leaders in power today, such as Macron, Scholz, and Sunak, cannot credibly advocate for a about turn in their position on Russia. New leadership will be needed to change national policy.
The other interested party in this conflict is the US. It has already committed to providing more than $54 billion to Ukraine. This is not a small amount, and the only reason for the US to commit to spending so much money on Ukraine is that it expects this to be a very long war. The US will not be happy at the prospect of Europe capitulating to Russia’s demands and making peace with them, even if new leadership rises in Europe to oust Scholz, Macron, and the Conservatives in the UK, demanding the end of hostilities with Russia. The US will do all it can to prevent a peace in Ukraine. It is fully committed to war. The US has huge leverage over Europe. This conflict has huge geopolitical implications for the projection of American military power beyond its shores, and the military-industrial establishment that runs the US cannot afford to give up its posture of power projection in Europe. Agreeing to a peace treaty on Russia’s terms will mean giving up the dream of American hegemony, which is completely unpalatable to the American establishment.
What this means, in effect, is that if there is huge social unrest that threatens to upend the current establishment ruling Europe, the US will step up and intervene militarily to prevent regime change in Europe. The war must go on. Russia must be defeated.
The US has already indicated that it will go to any lengths to achieve its goals. If things continue to worsen in Europe, there will be a trade war with China that will make Trump’s trade war with China look like child’s play. China will also be banned from SWIFT, and its nearly $1 trillion in US Treasury bonds will be seized by the US. China will retaliate by seizing the assets of American companies in China, by invading Taiwan in order to secure their semiconductor supply (which will give China control of 75% of the global semiconductor supply, including the most advanced nodes, once it gets control of TSMC), and by completely banning the sale of Chinese commodities to the US, ranging from lime, lead, tin, aluminium, magnesium, titanium, vanadium, tellurium, germanium, tungsten, molybdenum, silicon, graphite, fluorspar, alumina, and bauxite, to rare earths. Russia will join the trade war and stop selling platinum group metals, gold, sulfur, titanium, and most importantly wheat and sunflower oil to the West. And since Russia controls a significant part of Ukraine, it will prevent Ukrainian wheat and oilseeds from reaching the West as well. A trade war at this scale will have the following significant effects:
- It will completely split the world into two camps: the American and non-American camps
- The dollar will cease to be used outside the American camp
- The rest of the world will move to a multipolar world order with a basket of non-dollar currencies
- Every country in the world will have to choose a side
- Since China has deep connections with most countries in Asia and Africa, thanks to their decade-long Belt and Road Initiative, most of them will join the Chinese-Russian axis
- India will have a choice to make. It has been trying to walk a tightrope between the two sides, but that will no longer be possible
- Another region that will have to make tough choices is Oceania. Australia and New Zealand are ideologically allied with the US, but they are geographically isolated and surrounded by Asia, especially by China. Australia and New Zealand will find the going very tough if they continue to be in the Western camp
Who will win this new Cold War? The answer is simple. The Eastern alliance has more natural resources and more people (for markets). The West relies on the people of the Global South to buy its products; otherwise it will collapse. A new Cold War will completely destroy Western industry. America may be the engine of innovation, but without people to buy its products, it cannot survive.
This is the choice for the West to make. End the war on Russia’s terms, or destroy the West.
I am not optimistic that the West will make the right choice.
Overall Conclusions
- Europe and the US made a giant mistake in deciding to sanction Russia
- The West mistakenly thought that their economic sanctions would cripple Russia
- The West failed to understand Russia’s inherent economic resilience
- The West failed to understand the extent to which Europe, in particular, depended on Russia
- Europe is now at risk of de-industrialization and mass unemployment
- The root cause of the West’s miscalculation has been the failure to understand that the monetary value of Russian fossil energy is not high and never was, but its practical utility to Europe was and is extremely high. This is why sanctions on Russian oil and gas are a huge mistake and have hurt only Europe and not Russia
- There are no short-term solutions for Europe
- The only thing that can save Europe is for it to end the Ukraine conflict on Russia’s terms
- Any efforts to further intensify sanctions will deepen Europe’s crisis
- Attempts to expand the trade conflict by sanctioning China for its help to Russia will utterly ruin the West
- In a nutshell: Europe needs what Russia has (and what China has). It cannot do without those things. But Russia (and China) can do without what Europe has. They are self-sufficient. The financial impact of European sanctions on Russia is minimal. Therefore, economic sanctions against Russia (or China) will never work. But, because of the overwhelming dependence of Europe on Russian (and Chinese) goods, sanctions on Russia (or China) will utterly destroy Europe. The only hope for Europe to prevent a total economic catastrophe is to achieve an agreement with Russia that ends the current destructive sanctions as soon as possible, and at whatever political cost, including the abandonment of Ukraine and cession of Ukrainian territory to Russia. The longer this is postponed, the more extensive the permanent economic damage to Europe will be.
History is replete with trends and tipping points. Great shifts in power take place gradually and often imperceptibly, only bursting upon the public consciousness when dramatic events occur.
The Ukraine war will go down in history as one of those dramatic events that exposed a fundamental shift of power — from West to East.
A New World Order is taking birth before our eyes. The countries of the West, which have dominated the world in one form or another for the past three centuries, are receding in power. The civilisations of the East are regaining their autonomy.
The economic war over Ukraine will be as consequential as the military one in demonstrating to the world how decisively geopolitical and geo-economic power have shifted.
The biggest loser looks to be Europe. As I have shown here with detailed economic data from no less than Western sources, it is obvious that Europe has written its own epitaph with its ill-considered actions against a more powerful adversary that it grossly underestimated.
The sanctions on Russia will be seen in hindsight as Europe’s Stalingrad as well as its Waterloo.
List of Figures
Below is a list of links to the figures in this report, so that anyone who wishes to use this report as a resource can directly give the link to a particular figure from the report, without requiring someone to go through the entire report.
Fig. 001. The Russian Invasion of Ukraine
Fig. 002. The Renamed McDonald's in Moscow
Fig. 003. Russian Oil Revenues Since the Start of the War
Fig. 004. The Four Provinces Formally Annexed by Russia
Fig. 005. Ganesh Prasad's Representation of Europe's Sanctions Against Russia
Fig. 006. The Decline in US Strategic Petroleum Reserve Stocks
Fig. 007. The Evolution of the Korean War (1950-53) and China's Entry into the War
Fig. 008. How Sanctions Against Russia are a Western Enterprise
Fig. 009. The Fall and Rise of the Ruble After the Invasion of Ukraine, 2022
Fig. 010. How Western Sanctions Affected Russia in 2014
Fig. 011. Manufacturing as % of GDP, Russia v/s Europe and USA
Fig. 012. Avg. GDP Growth Rate, 2000-2019, Russia v/s Europe and USA
Fig. 013. Annual % GDP Growth Rate, 2000-2018, Russia, UK, Germany
Fig. 014. GDP Per Capita, PPP, 2000-2021
Fig. 015. Average % annual growth, GDP per capita, PPP, 2000-2021
Fig. 016. Total Debt as a Percentage of GDP, for Russia and Various Advanced Countries
Fig. 017. The Rise in China and Japan's Ownership of US Treasury Bonds
Fig. 018. Annual GDP Growth Rate Due to High Debt
Fig. 019. Compounded GDP Growth Factor with Year 2000 as Base, Japan and UK
Fig. 020. Compounded GDP Growth Factor with Year 2000 as Base, USA
Fig. 021. Reduction in China's Ownership of US Treasury Bonds
Fig. 022. Drop in Russia's Ownership of US Treasury Bonds in 2017-18
Fig. 023. Recent Drop in Russian Ownership of US Treasury Bonds
Fig. 024. Growth in Russian Gold Reserves in Million USD
Fig. 025. Growth in Russian Gold Reserves in Tons of Gold
Fig. 026. World's Largest Arms Exporters, 2000-2020
Fig. 027. Russian Arms Exports to Algeria, 1991-2020
Fig. 028. Russian Arms Exports to China, 1991-2020
Fig. 029. Russian Arms Exports to Egypt, 1991-2020
Fig. 030. Russian Arms Exports to India, 1991-2020
Fig. 031. Russia's Trade Surpluses with the entire World and the Eurozone, 2000-2020
Fig. 032. Russia's EXIM Ratios with the entire World and with the Eurozone, 2000-2020
Fig. 033. EXIM Ratios for Russia with Various European Countries in 2020
Fig. 034. Breakup of Russia's Exports to Norway, 2020 ($1.1 Bn)
Fig. 035. Proportion of Various Means of Energy Production in Europe, 1990-2020
Fig. 036. Percentage Breakup of Norway's Energy Sources, 2020
Fig. 037. The Decline of Coal in Europe Over the Last 30 Years
Fig. 038. Fossil Fuel Dependence of Major European Nations, 2020
Fig. 039. Breakup of Russia's Exports by Destination Continent, 2020
Fig. 040. Breakup of Russia's Imports by Origin Continent, 2020
Fig. 041. Key Destinations for Russian Exports in Asia, 2020
Fig. 042. Key Destinations for Russian Exports in Europe, 2020
Fig. 043. Key Origins for Russian Imports in Asia, 2020
Fig. 044. Key Origins for Russian Imports in Europe, 2020
Fig. 045. Tree Map of Russia's Export Destinations in 2020 (Total $330 Bn)
Fig. 046. Tree Map of Russia's Import Origins in 2020 (Total $220 Bn)
Fig. 047. EXIM Ratios of Russia with Various Asian Countries, 2020
Fig. 048. EXIM Ratios of Russia with Various European Countries, 2020
Fig. 049. EXIM Ratios of Russia with Various African Countries, 2020 (1/3)
Fig. 050. EXIM Ratios of Russia with Various African Countries, 2020 (2/3)
Fig. 051. EXIM Ratios of Russia with Various African Countries, 2020 (3/3)
Fig. 052. Breakup of Russia's 2020 Exports by Category (Total: $330 Bn)
Fig. 054. Breakup of Russia's 2000 Exports by Category (Total: $104 Bn)
Fig. 055. CAGR of Russia's Exports, 2000-2020
Fig. 056. Russia's Oil Exports by Destination, 2020
Fig. 057. Russia's Natural Gas Exports by Destination, 2020
Fig. 058. Category-wise Break-up of Russia's Exports to China (2020)
Fig. 059. Category-wise Break-up of China's Exports to Russia in 2020 (Total: $50.7 Bn)
Fig. 060. Break-up of Russian Exports to Saudi Arabia by Category, 2020 ($1.58 Bn)
Fig. 061. Break-up of Exports from Saudi Arabia to Russia by Category, 2020 ($202 Mn)
Fig. 062. Break-up of Exports from Russia to the UAE by Category, 2020 ($2.59 Bn)
Fig. 063. Break-up of Exports from the UAE to Russia by Category, 2020 ($561 Mn)
Fig. 064. Break-up of Russian Exports to Turkey by Category, 2020 ($13.1 Bn)
Fig. 065. Break-up of Exports from Turkey to Russia by Category, 2020 ($4.5 Bn)
Fig. 066. Break-up of Russian Exports to Kazakhstan by Category, 2020 ($13.8 Bn)
Fig. 067. Break-up of Exports from Kazakhstan to Russia by Category, 2020 ($5.18 Bn)
Fig. 068. Break-up of Russian Exports to Finland by Category, 2020 ($6.81 Bn)
Fig. 069. Break-up of Exports from Finland to Russia by Category, 2020 ($3.46 Bn)
Fig. 070. Break-up of Russian Exports to the Netherlands by Category, 2020 ($22.5 Bn)
Fig. 071. Break-up of Exports from the Netherlands to Russia by Category, 2020 (6.46 Bn)
Fig. 072. Break-up of Russian Exports to Poland by Category, 2020 ($8.66 Bn)
Fig. 073. Break-up of Exports from Poland to Russia by Category, 2020 ($7.63 Bn)
Fig. 074. Break-up of Russian Exports to Italy by Category, 2020 ($11.9 Bn)
Fig. 075. Break-up of Exports from Italy to Russia by Category, 2020 ($7.71 Bn)
Fig. 076. Break-up of Russian Exports to Germany by Category, 2020 ($14.2 Bn)
Fig. 077. Break-up of Exports from Germany to Russia by Category, 2020 ($26.1 Bn)
Fig. 078. Break-up of Russian Exports to France by Category, 2020 ($4.93 Bn)
Fig. 079. Break-up of Exports from France to Russia by Category, 2020 ($5.97 Bn)
Fig. 080. Break-up of Russian Exports to the UK by Category, 2020 ($25.3 Bn)
Fig. 081. Break-up of UK Exports by Category, 2020 ($371 Bn)
Fig. 082. Break-up of Russian Exports to the UK by Category, without Fossil Fuels, 2020 ($4.35 Bn)
Fig. 083. Sale of Gold in International Gold Exchanges
Fig. 084. Break-up of Exports from the UK to Russia by Category, 2020 ($2.84 Bn)
Fig. 085. Break-up of Malaysian Exports to Russia by Category, 2020 ($959 Mn)
Fig. 086. Break-up of Vietnamese Exports to Russia by Category, 2020 ($3.15 Bn)
Fig. 087. Break-up of Indian Exports to Russia by Category, 2020 ($2.87 Bn)
Fig. 088. Poland's Total Imports, by Country of Origin, 2020 (Total: $269 Bn)
Fig. 089. Italy's Total Imports, by Country of Origin, 2020 ($429 Bn)
Fig. 090. Germany's Total Imports, by Country of Origin, 2020 ($1.1 Tn)
Fig. 091. France's Total Imports, by Country of Origin, 2020 ($562 Bn)
Fig. 092. The UK's Total Imports, by Country of Origin, 2020 ($610 Bn)
Fig. 093. Break-up of Europe's Total Energy Use by Energy Source, 2019 (Petajoules)
Fig. 094. Break-up of Europe's Total Energy Use by Energy Source, 2020 (Petajoules)
Fig. 095. Break-up of Europe's Total Energy Use by Energy Source, 2020 (Percentages)
Fig. 096. Break-up of Europe's Energy Production, by Energy Source, 2020 (Petajoules)
Fig. 097. Europe's Energy Shortfall, 2020 (Petajoules)
Fig. 098. Europe's Energy Shortfall in Percentage Terms by Energy Source, 2020
Fig. 099. Energy Import Dependency of Various European Countries, 2020
Fig. 100. Europe's Requirement for Energy Imports from Russia, by Energy Source, 2020
Fig. 101. Top Gas Exporters in the World
Fig. 102. The Gas Pipelines from Russia to Europe
Fig. 103. Top World Exporters of Crude Oil, Percentages of Total, 2018
Fig. 104. Top World Exporters of Crude Oil, Percentages, 2018
Fig. 105. Top World Exporters of Crude Oil, Million Tons Per Year, 2018
Fig. 106. Increase in Annual Global Exports of Crude Oil, 1980-2018
Fig. 107. Increase in Annual Global Production of Crude Oil, 1980-2020
Fig. 108. Emergency Stocks of Crude Oil in Different European Countries, July 2022
Fig. 109. Top World Coal Exporters, Million Metric Tons, 2020
Fig. 110. Top World Coal Exporters, Percentages, 2020
Fig. 111. Break-up of Germany's Energy Usage by Energy Source, 2020
Fig. 112. Germany's Imports of Natural Gas by Origin Country, 2020
Fig. 113. Germany's Imports of Oil and Petroleum Products by Origin Country, 2020
Fig. 114. Germany's Exports of Oil and Petroleum Products by Destination Country, 2020
Fig. 115. Germany's Imports of Coal by Origin Country, 2020
Fig. 116. Break-up of Poland's Energy Usage by Energy Source, 2020
Fig. 117. Poland's Imports of Natural Gas by Origin Country, 2020
Fig. 118. Poland's Imports of Oil and Petroleum Products by Origin Country, 2020
Fig. 119. Poland's Exports of Oil and Petroleum Products by Destination Country, 2020
Fig. 120. Poland's Imports of Coal by Origin Country, 2019
Fig. 121. Break-up of the UK's Energy Usage by Energy Source, 2020
Fig. 122. The UK's Imports of Natural Gas by Origin Country, 2019
Fig. 123. The UK's Imports of Oil and Petroleum Products by Origin Country, 2019
Fig. 124. The UK's Exports of Oil and Petroleum Products by Destination Country, 2019
Fig. 125. The UK's Imports of Coal by Origin Country, 2019
Fig. 126. Break-up of Italy's Energy Usage by Energy Source, 2020
Fig. 127. Italy's Imports of Natural Gas by Origin Country, 2020
Fig. 128. Italy's Imports of Oil and Petroleum Products by Origin Country, 2020
Fig. 129. Italy's Imports of Coal by Origin Country, 2020
Fig. 130. Break-up of France's Energy Usage by Energy Source, 2020
Fig. 131. France's Imports of Natural Gas by Origin Country, 2020
Fig. 132. France's Imports of Oil and Petroleum Products by Origin Country, 2020
Fig. 133. France's Imports of Coal by Origin Country, 2020
Fig. 134. Percentage of Total Gas Imports Originating from Russia, 2020 (UK: 2019)
Fig. 135. Percentage of Total Oil Imports Originating from Russia, 2020 (UK: 2019)
Fig. 136. Percentage of Total Coal Imports Originating from Russia, 2020 (UK: 2019)
Fig. 137. Percentage of National Gas Requirement Imported from Russia, 2020 (UK: 2019)
Fig. 138. Percentage of National Oil Requirement Imported from Russia, 2020 (UK: 2019)
Fig. 139. Percentage of National Coal Requirement Imported from Russia, 2020 (UK: 2019)
Fig. 139a. Energy Flow Chart Showing Russia's Gas Supply to Europe
Fig. 139b. Energy Flow Chart Showing Russia's Oil Supply to Europe
Fig. 139c. Energy Flow Chart Showing Russia's Coal Supply to Europe
Fig. 139d. Energy Flow Chart Showing Europe's Fossil Fuel Dependency on Russia
Fig. 141. Cost-Benefit Analysis of European Sanctions on Russia
Fig. 142. Idled Steel Plants in the EU as of September 6, 2022, Because of Energy Shortages
Fig. 143. Letter from Eurometaux to EU President Ursula Von Der Leyen, September 6, 2022
Fig. 145. Start of the Gas Price Crisis in February 2021 Due to Post-Covid Rise in Demand
Fig. 146. Drop in EU Gas Prices Since the September 2022 Peak After the Rise Due to the War
Fig. 147. Drop in EU Gas Demand, January to October 2022
Fig. 148. Drop in EU Gas Demand, October 2022
Fig. 149. Components of Ammonia Cost in Different Geographies
Fig. 150. Top Ten Global Ammonia Producers, 2012
Fig. 151. Rise in Fertilizer Prices Since February 2021
Fig. 152. Market Share of Russia, Ukraine, and Belarus in Major Fertilizers
Fig. 153. Final Energy Consumption by Sector in the EU, 2020
Fig. 154. Top World Producers of Wheat, 2020
Fig. 155. Top World Producers of Sunflower Oil, 2020
Fig. 156. Top World Producers of Gold, 2021
Fig. 157. Exports of Wheat by Origin Country, 2020
Fig. 158. Importers of Wheat by Destination Country, 2020
Fig. 159. Importers of Russian Wheat, 2020
Fig. 160. Exporters of Sunflower Seeds, 2020
Fig. 161. Exporters of Sunflower seed and safflower oil, crude, 2020
Fig. 162. Importers of Sunflower seed and Safflower Oil, crude, 2020
Fig. 163. Exporters of Urea, 2020
Fig. 164. Exporters of Ammonia, 2020
Fig. 165. Top World Producers of Potash, 2021
Fig. 166. Exporters of Potassic Fertilizer, 2018
Fig. 167. Importers of Potassic Fertilizers from Russia, 2020
Fig. 168. Importers of Potassic Fertilizer from Belarus, 2020
Fig. 169. Top World Producers of Phosphate Rock, 2021
Fig. 170. Exporters of Phosphatic Fertilizer, 2020
Fig. 171. Exporters of Phosphoric Acid, 2020
Fig. 172. Top World Producers of Aluminium, 2021
Fig. 173. Exporters of Aluminium, 2018
Fig. 174. Top World Producers of Iron Ore, 2021
Fig. 175. Exporters of Iron Ore, 2020
Fig. 176. Top World Producers of Pig Iron, 2021
Fig. 177. Top World Producers of Raw Steel, 2021
Fig. 178. Importers of Iron Ore, 2020
Fig. 179. Exporters of Pig Iron, 2020
Fig. 180. Exporters of Iron Ingots, 2020
Fig. 181. Importers of Pig Iron from Russia, 2020
Fig. 182. Exporters of Iron Wire, 2020
Fig. 183. Exporters of Iron Pipes, 2020
Fig. 184. Exporters of Iron Cloth, 2020
Fig. 185. Exporters of Iron Nails, 2020
Fig. 186. Exporters of Stainless Steel Wire, 2020
Fig. 187. Top World Producers of Copper Ore, 2021
Fig. 188. Exporters of Copper Ore, 2020
Fig. 189. Importers of Copper Ore, 2020
Fig. 190. Top World Producers of Metallic Copper, 2021
Fig. 191. Exporters of Copper, 2018
Fig. 192. Exporters of Copper Pipes, 2020
Fig. 193. Exporters of Copper Wire, 2020
Fig. 194. Top World Producers of Magnesium, 2021
Fig. 195. Exporters of Magnesium, 2020
Fig. 196. Importers of Magnesium, 2020
Fig. 197. Top World Producers of Nickel, 2021
Fig. 198. Exporters of Nickel, 2018
Fig. 199. Exporters of Nickel Ore, 2020
Fig. 200. Importers of Nickel Ore, 2020
Fig. 201. Exporters of Nickel Matte, 2020
Fig. 202. Importers of Nickel Matte, 2020
Fig. 203. Top World Producers of Sulfur, 2021
Fig. 204. Exporters of Sulfur, 2020
Fig. 205. Exporters of Ammonium Sulfate, 2020
Fig. 206. Top World Producers of Titanium, 2021
Fig. 207. Exporters of Titanium, 2020
Fig. 208. Importers of Titanium from Russia, 2020
Fig. 209. Top World Producers of Vanadium, 2021
Fig. 210. Top World Producers of Tellurium, 2021
Fig. 211. Top World Producers of Cobalt, 2021
Fig. 212. Top World Producers of Germanium, 2021
Fig. 213. Top World Producers of Tungsten, 2021
Fig. 214. Top World Producers of Palladium, 2021
Fig. 215. Top World Producers of Platinum, 2021
Fig. 216. Exporters of Industrial Diamonds, 2018
Fig. 217. Top World Producers of Bauxite, 2021
Fig. 218. Top World Producers of Alumina, 2021
Fig. 219. Top World Producers of Lead, 2021
Fig. 220. Exporters of Permanent Magnets, 2020
Fig. 221. Top World Producers of Rare Earths, 2021
Fig. 222. Top World Producers of Silicon, 2021
Fig. 223. Exporters of Silicon, 2020
Fig. 224. Top World Producers of Fluorspar, 2021
Fig. 225. Top World Producers of Tin, 2021
Fig. 226. Top World Producers of Lithium, 2021
Fig. 227. Exporters of Lithium Carbonate, 2020
Fig. 228. Exporters of Lithium Cells and Batteries, 2020
Fig. 229. Top World Producers of Lime, 2021
Fig. 230. Top World Producers of Natural Graphite, 2021
Fig. 231. Exporters of Graphite, 2020
Fig. 232. Top World Producers of Gallium, 2021
Fig. 233. Top World Producers of Manganese, 2021
Fig. 234. Exporters of Manganese, 2020
Fig. 235. Top World Producers of Molybdenum, 2021
Fig. 236. Exporters of Molybdenum, 2020
Fig. 237. Why It is Not Enough to Have Full Gas Tanks Without Supply
Fig. 238. Existing LNG Terminals in Europe, New Proposed Ones, and Terminals Under Construction
Fig. 239. Utilization Rate of LNG Terminals in Europe, Pre-War