1 / 120

A Detailed Economic Analysis of the Modi Sarkar
2 / 120
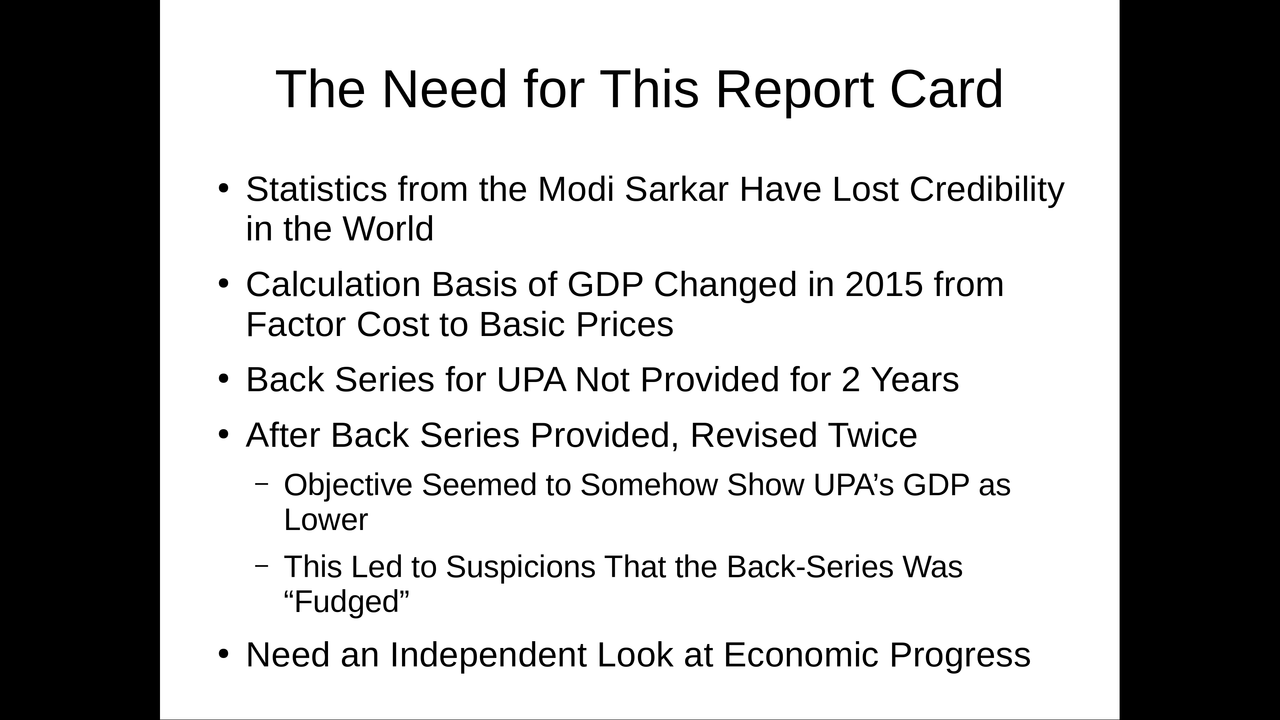
Why This Report Card
3 / 120
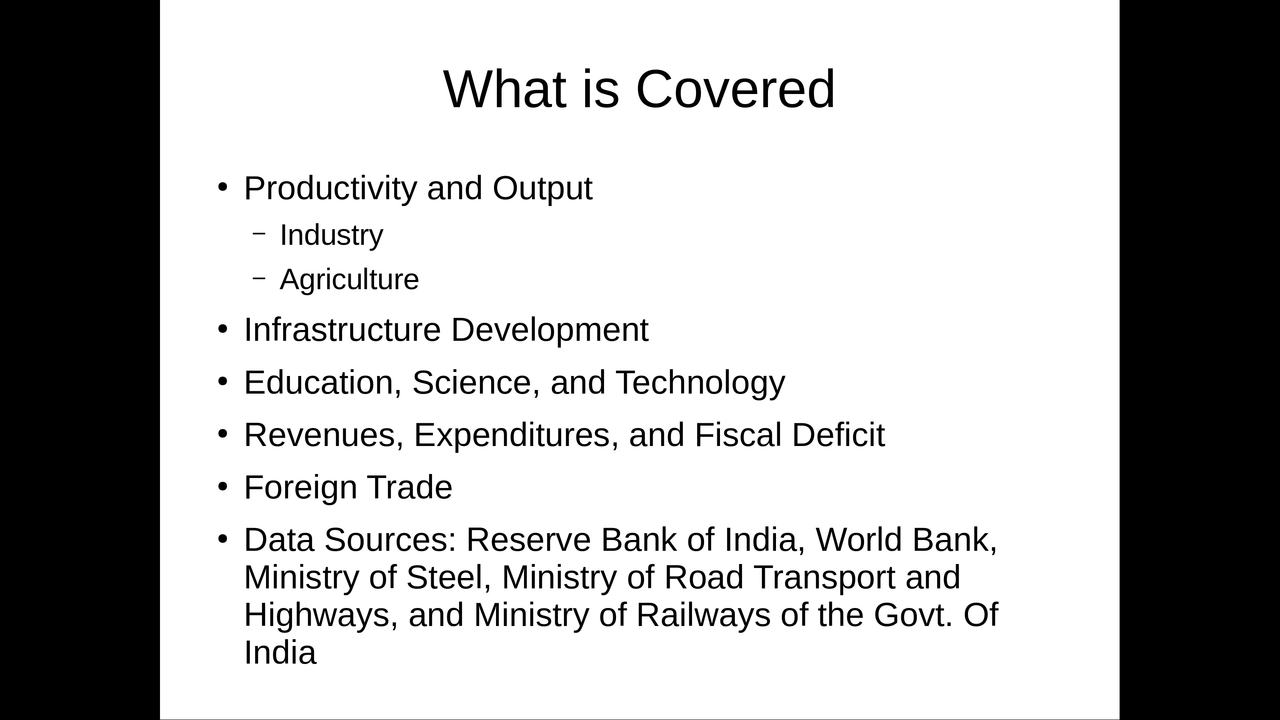
Contents
4 / 120
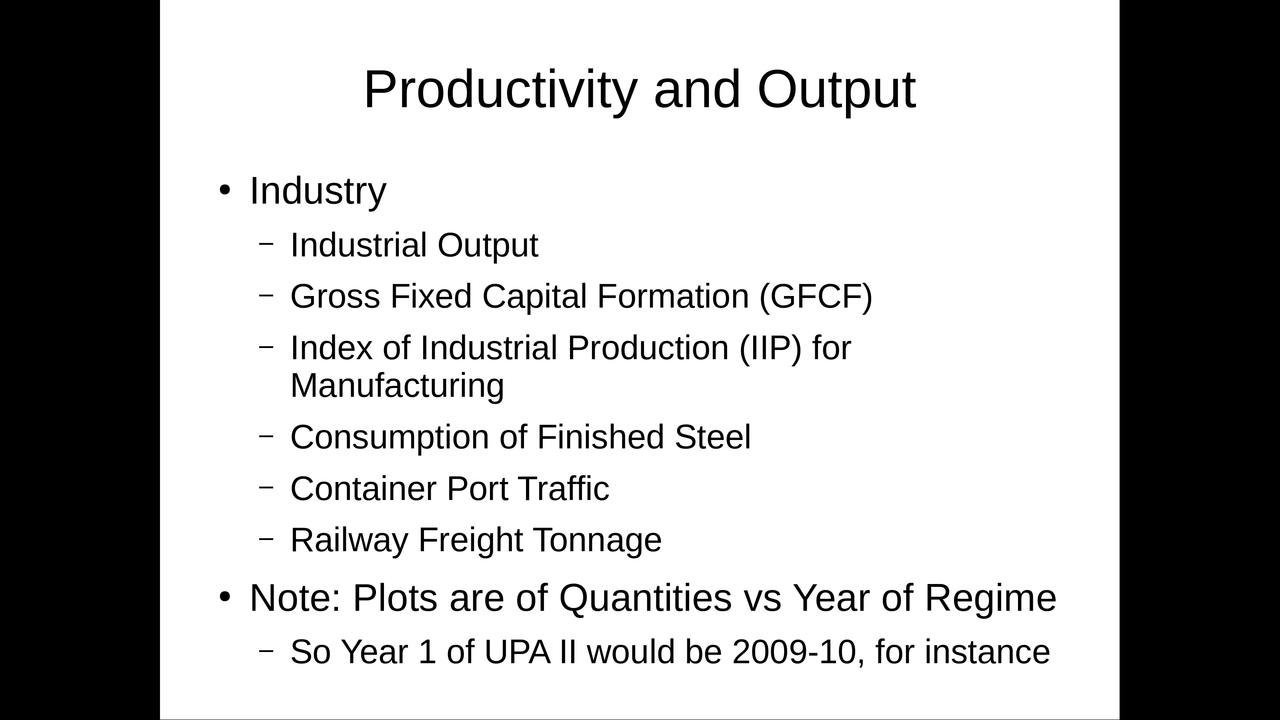
Industrial Productivity and Output
5 / 120
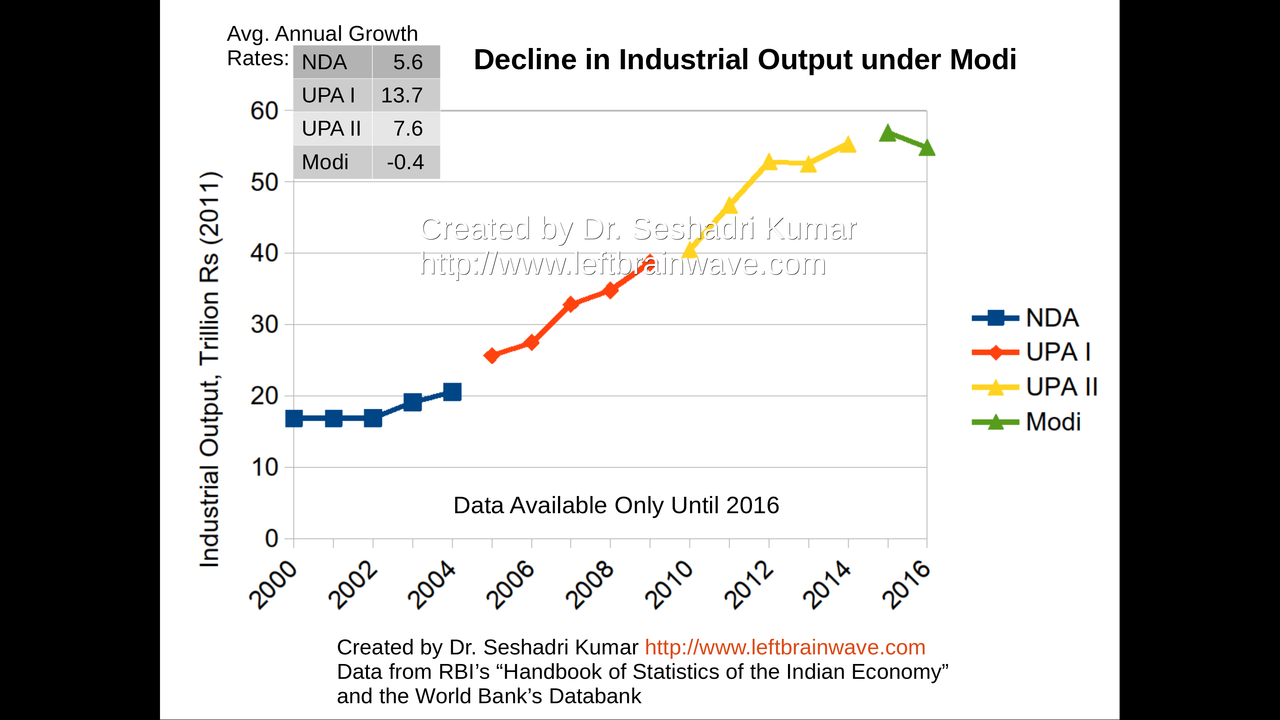
Industrial Output Growth for Different Regimes
6 / 120
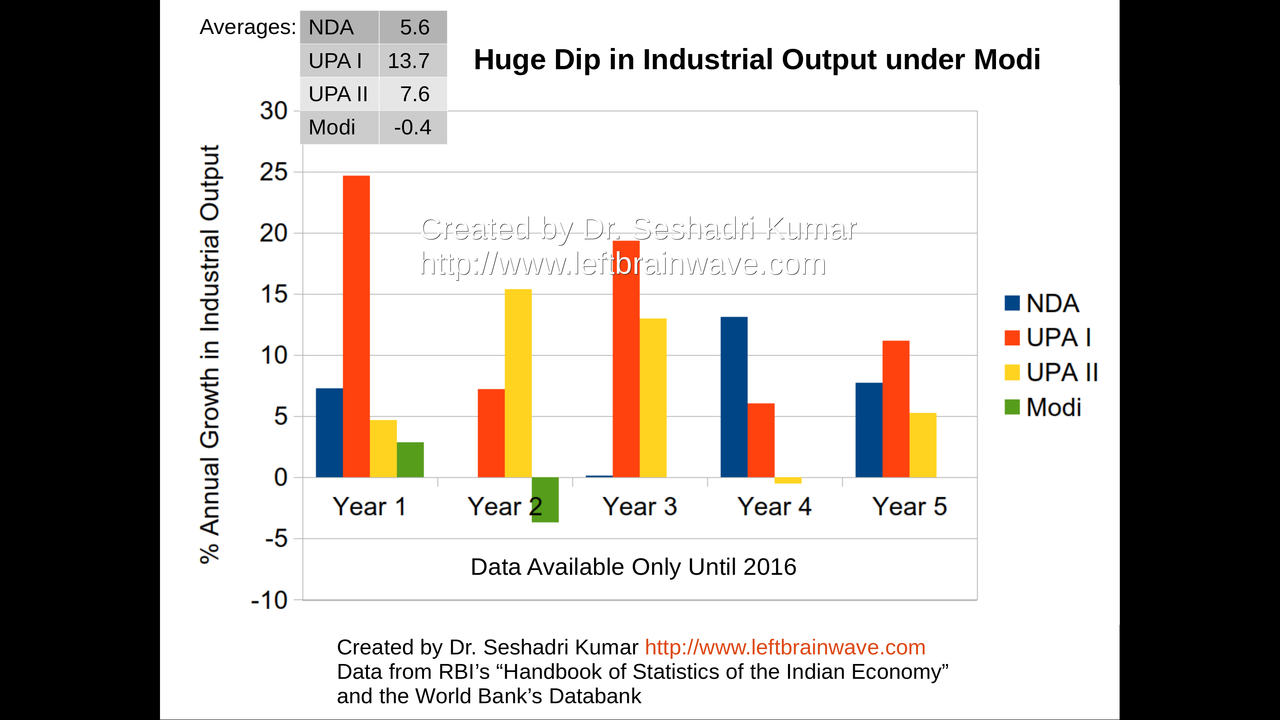
Industrial Output Growth for Different Regimes
7 / 120
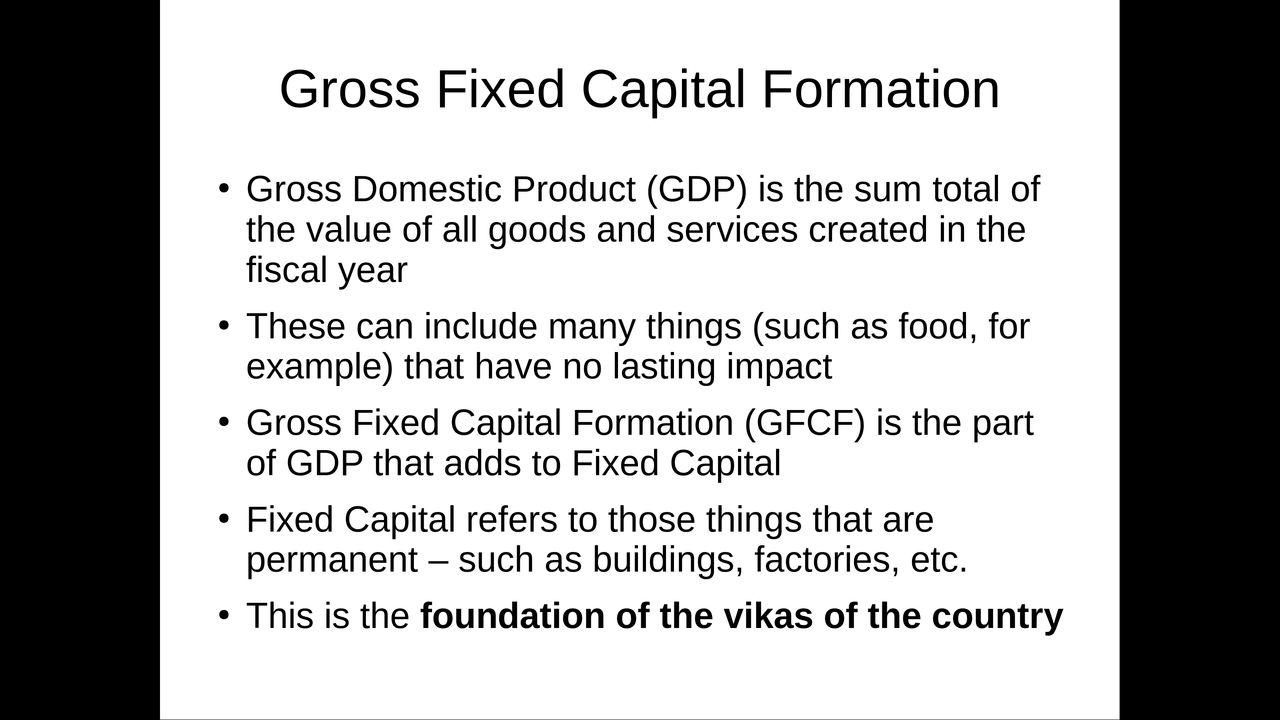
Gross Fixed Capital Formation
8 / 120

GFCF for Different Regimes
9 / 120
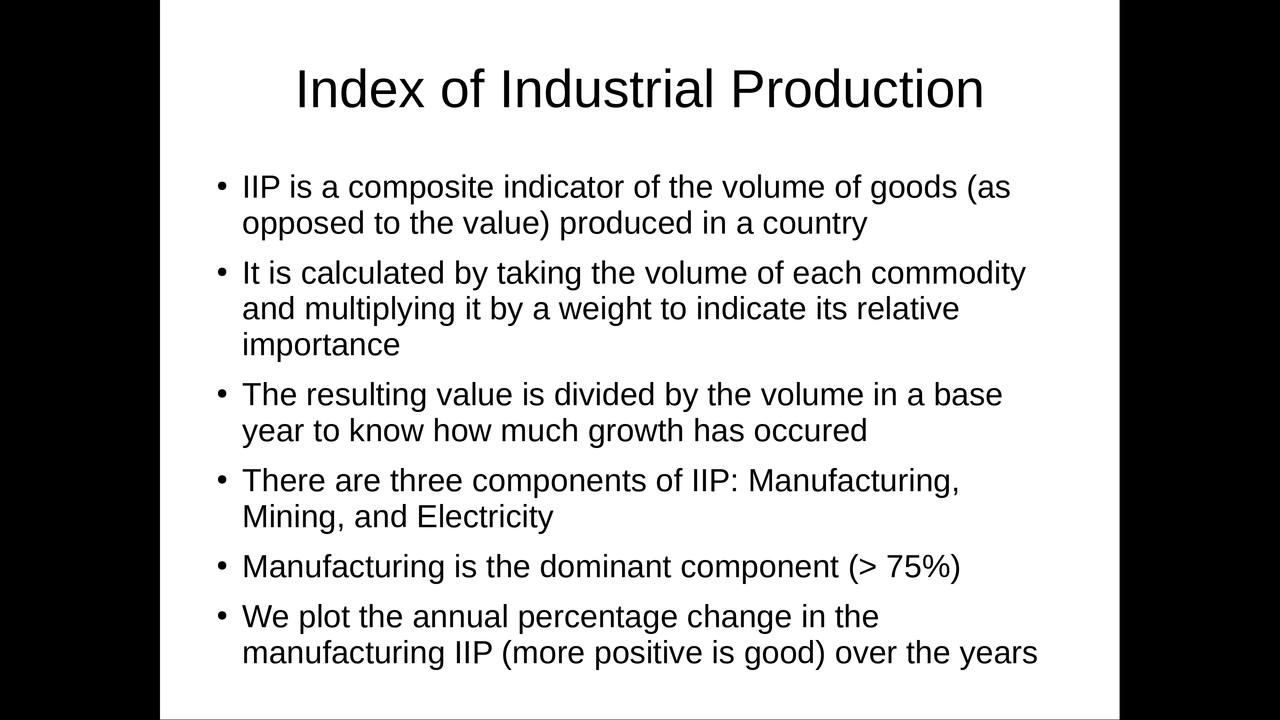
Index of Industrial Production
10 / 120
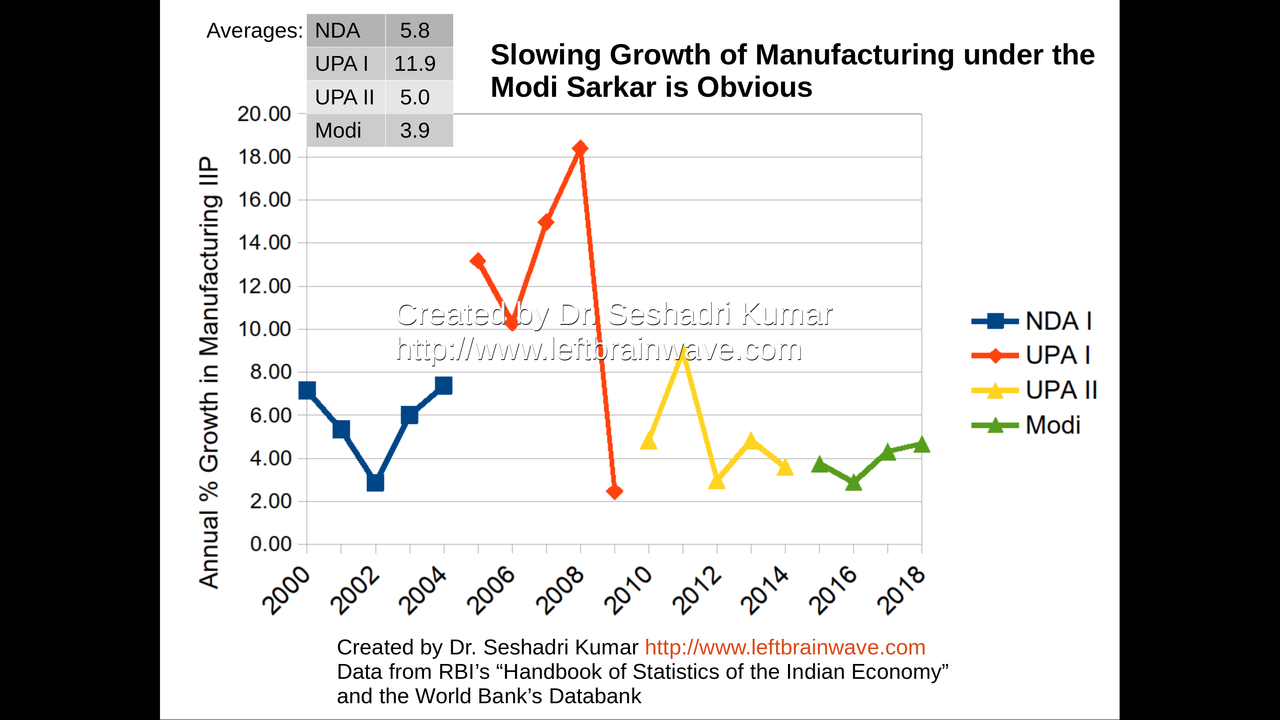
Growth in IIP for Manufacturing for Different Regimes
11 / 120
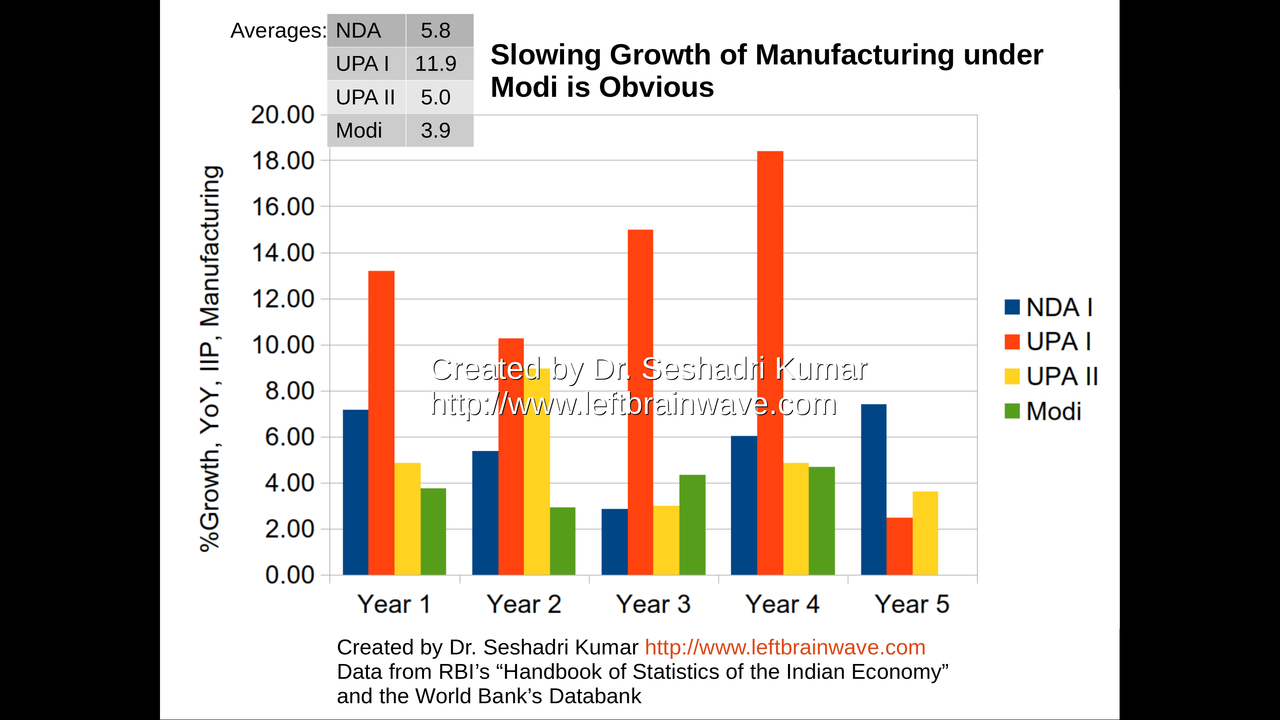
Growth in IIP for Manufacturing for Different Regimes
12 / 120
Consumption of Finished Steel
13 / 120
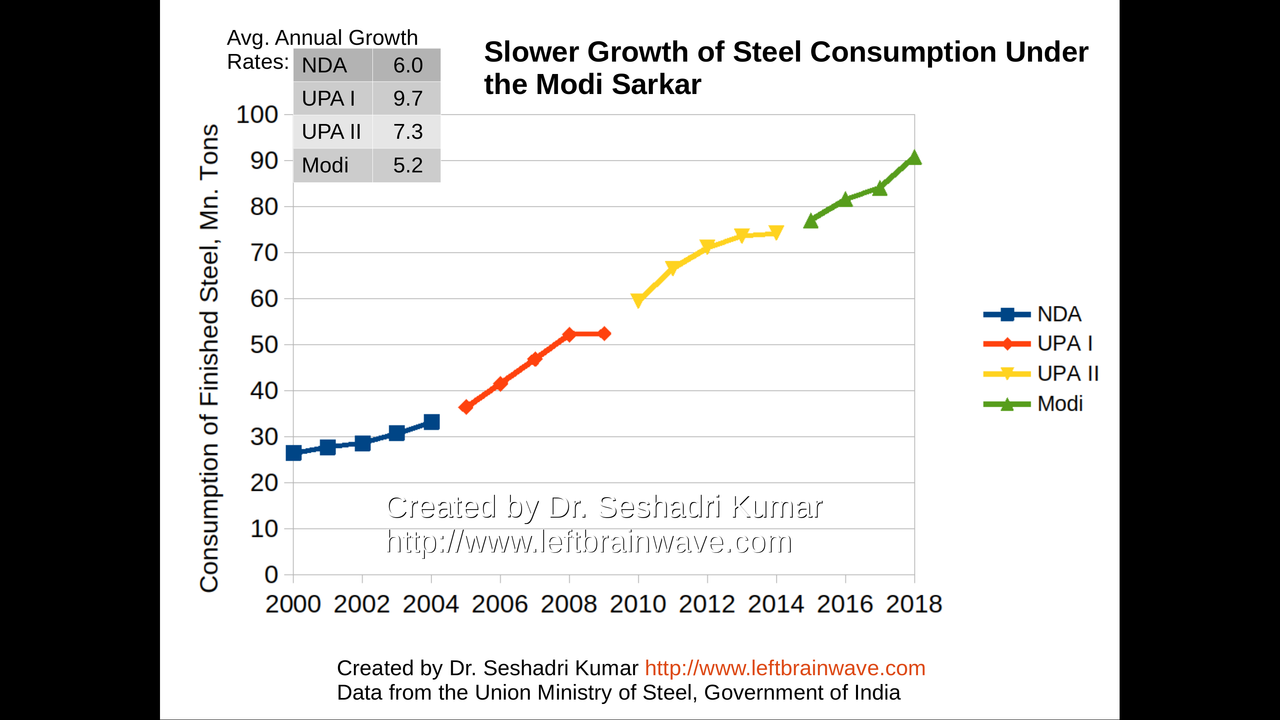
Growth Rate of Steel Consumption for Different Regimes
14 / 120
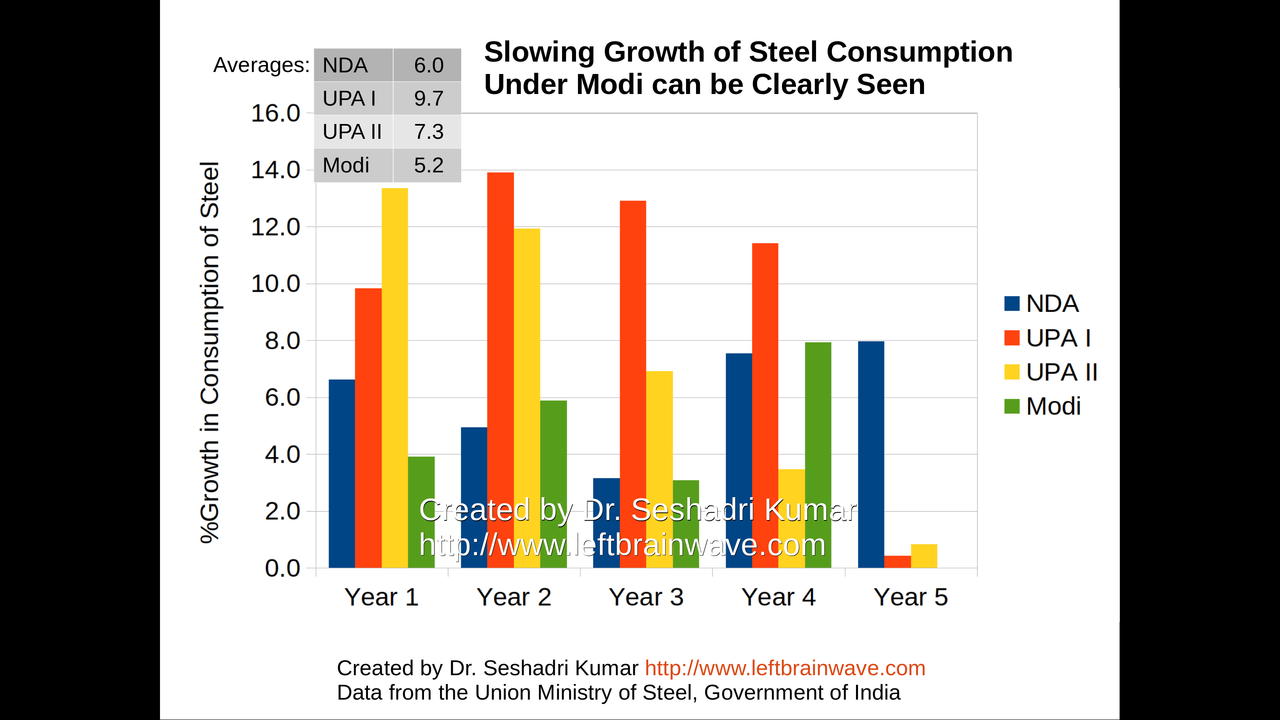
Growth Rate of Steel Consumption for Different Regimes
15 / 120
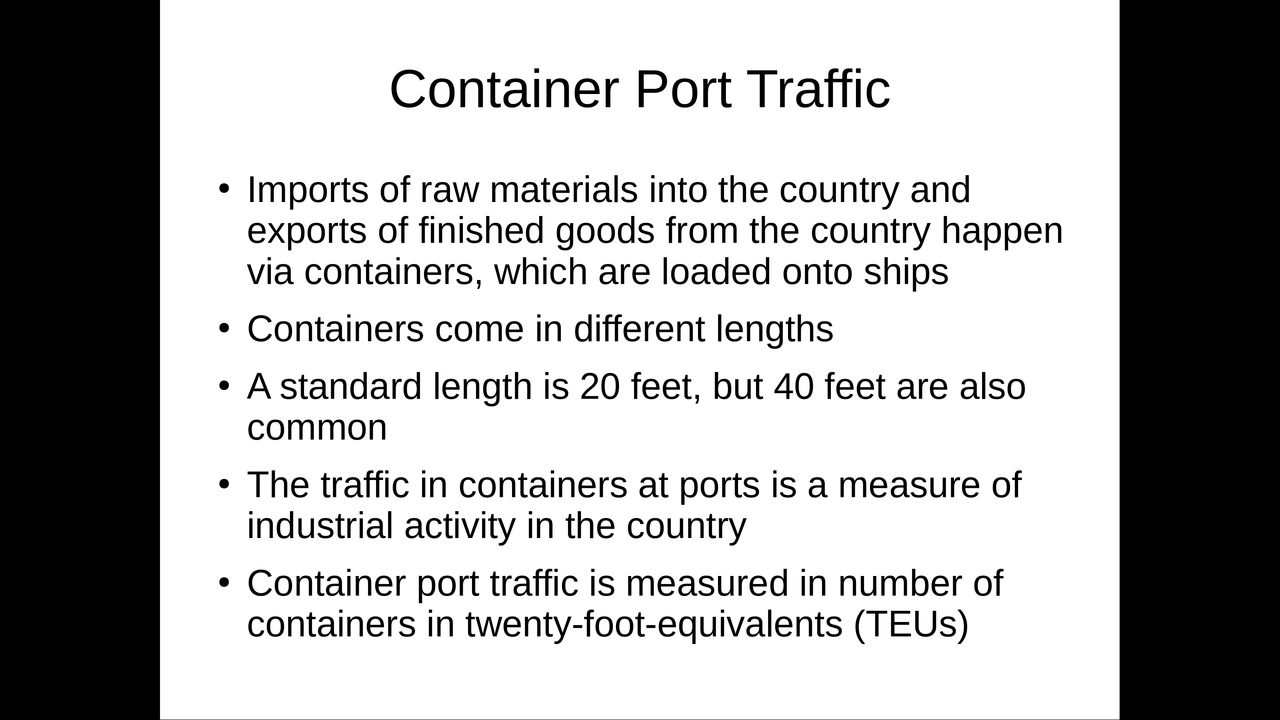
Container Port Traffic
16 / 120
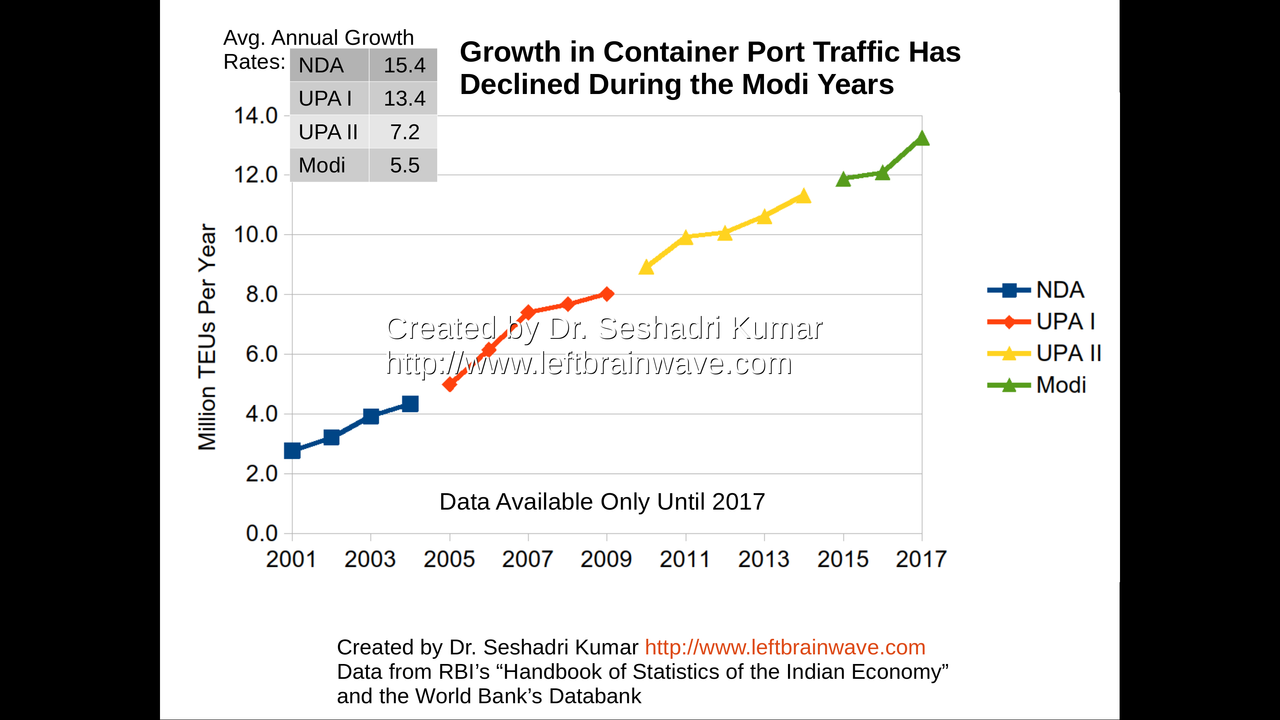
Container Port Traffic Growth for Different Regimes
17 / 120
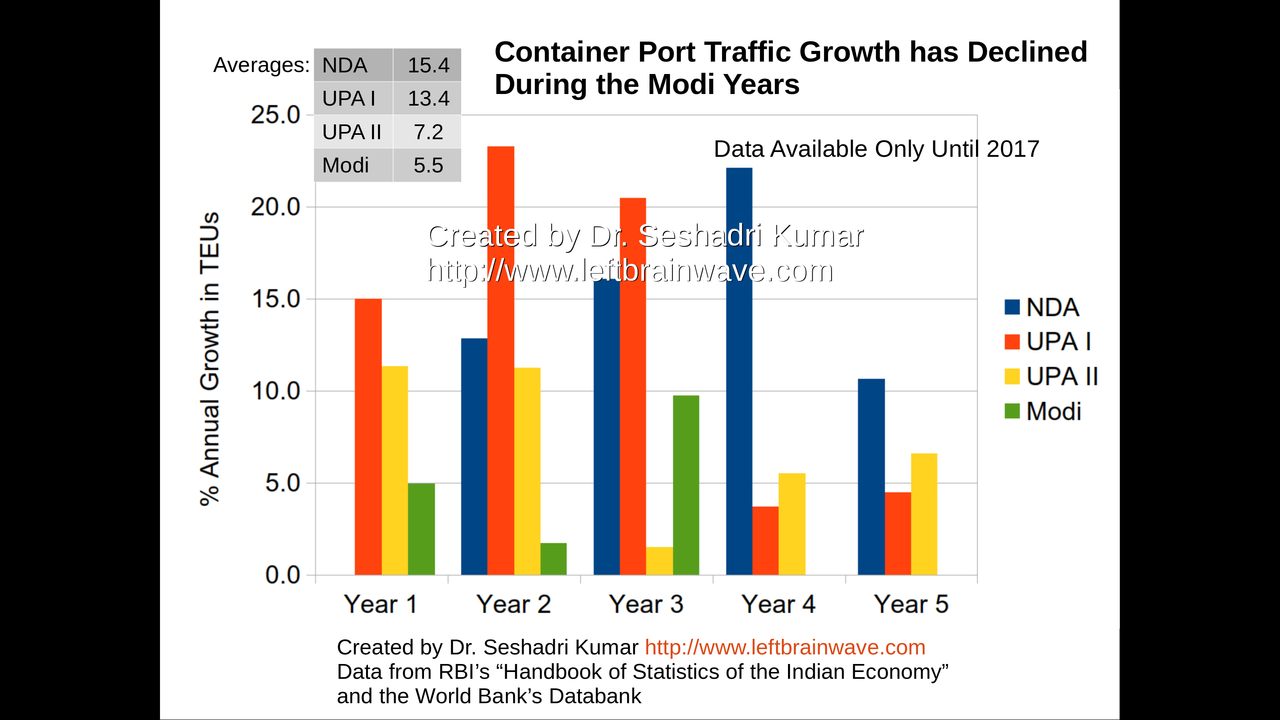
Container Port Traffic Growth for Different Regimes
18 / 120
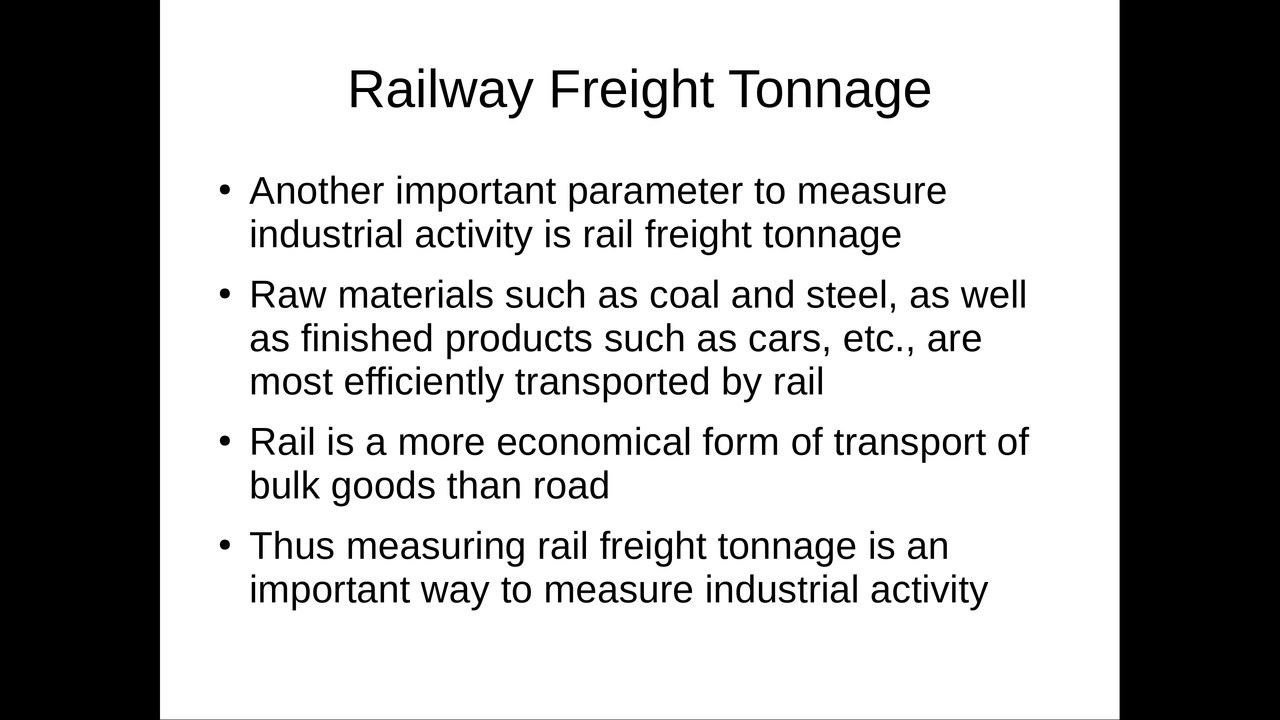
Railway Freight Tonnage
19 / 120
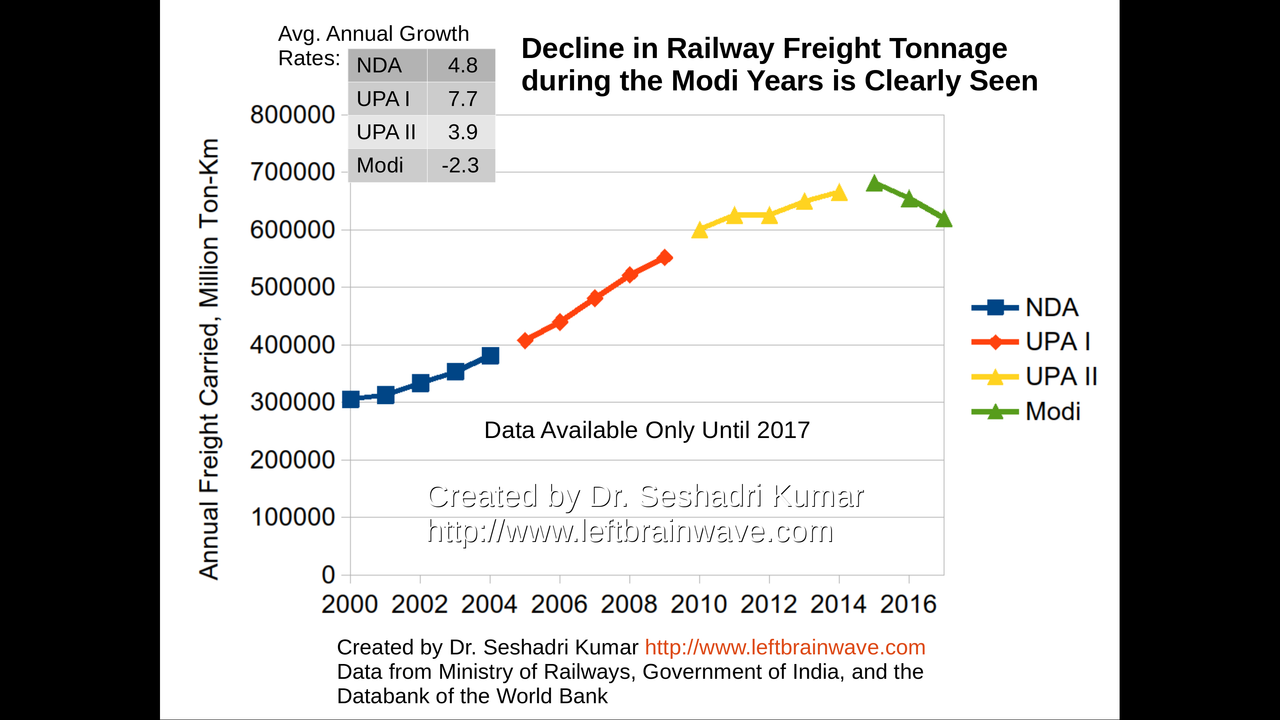
Growth in Railway Freight Tonnage for Different Regimes
20 / 120
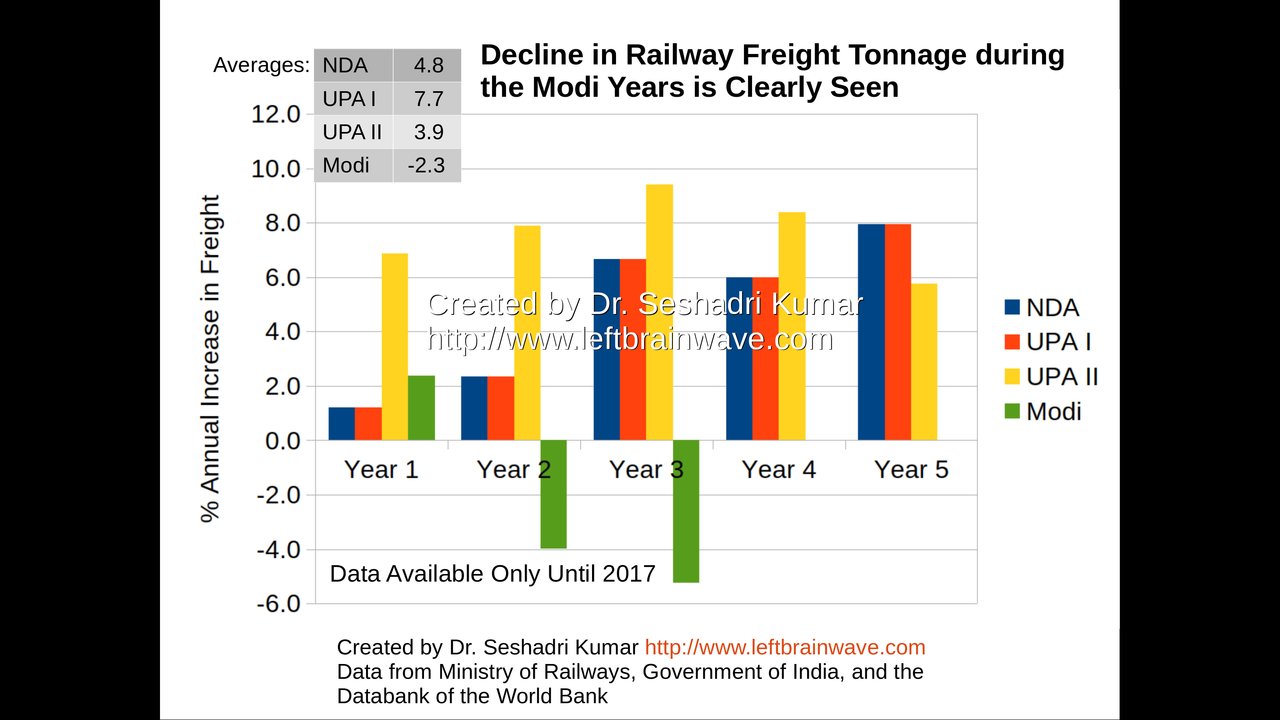
Growth in Railway Freight Tonnage for Different Regimes
21 / 120

Summary: Industrial Productivity and Output
22 / 120

Agricultural Output
23 / 120
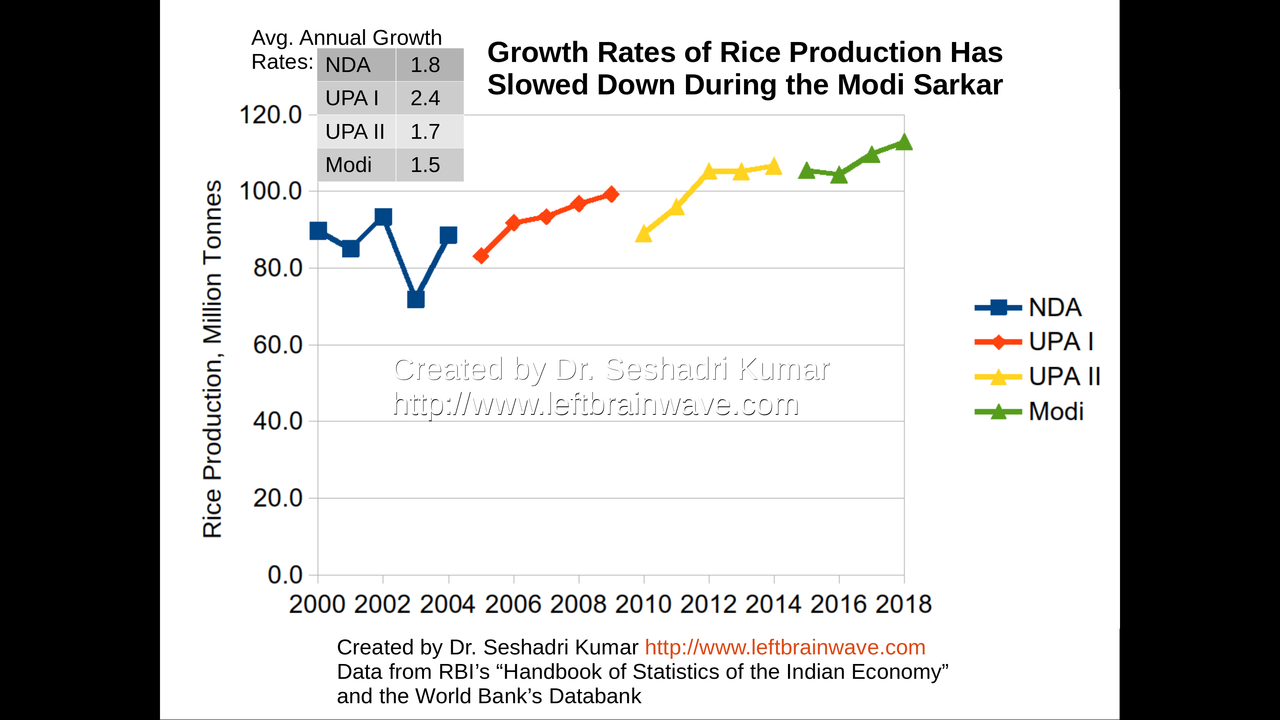
Annual Growth in Rice Production for Different Regimes
24 / 120
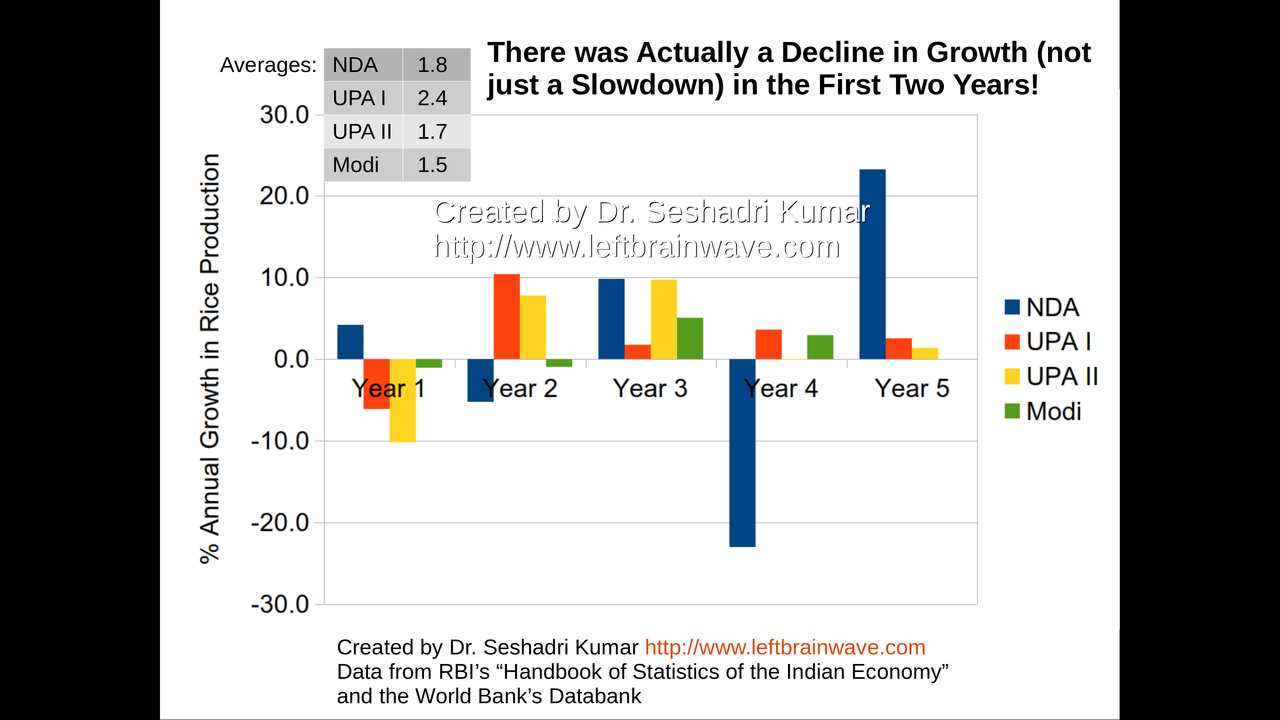
Annual Growth in Rice Production for Different Regimes
25 / 120
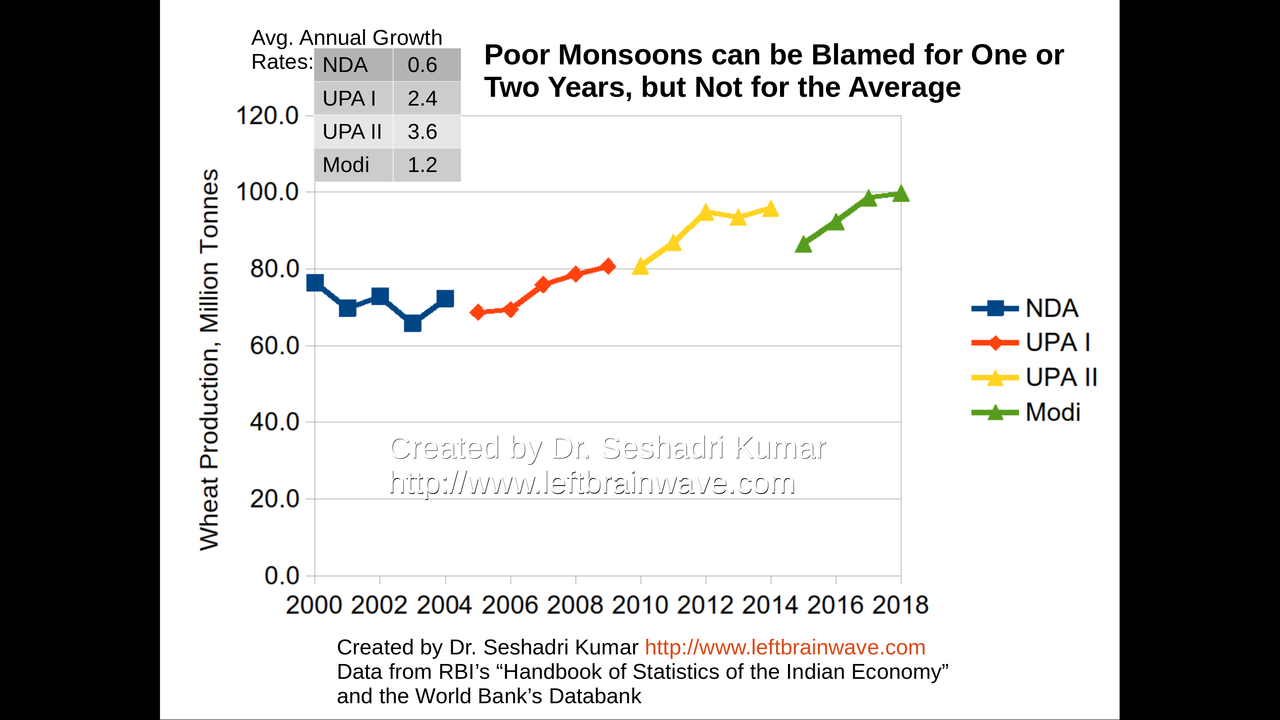
Annual Growth in Wheat Production for Different Regimes
26 / 120

Annual Growth in Wheat Production for Different Regimes
27 / 120
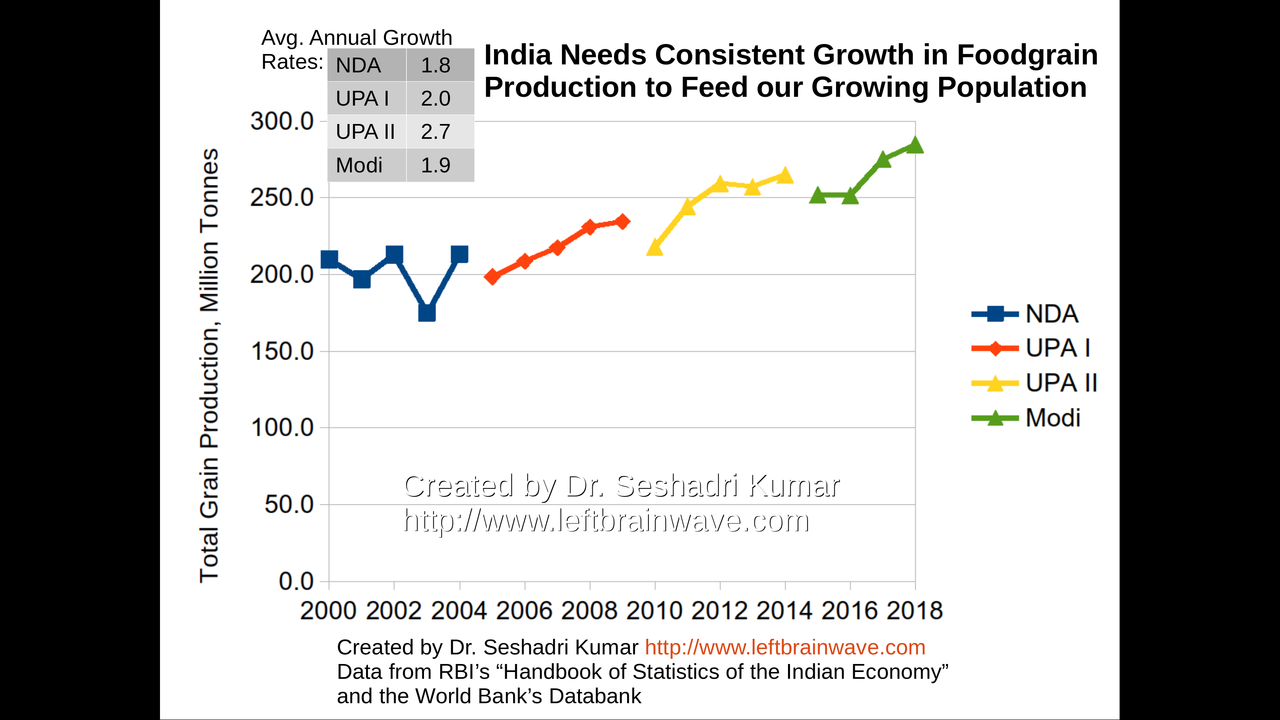
Annual Growth in Total Foodgrain Production for Various Regimes
28 / 120
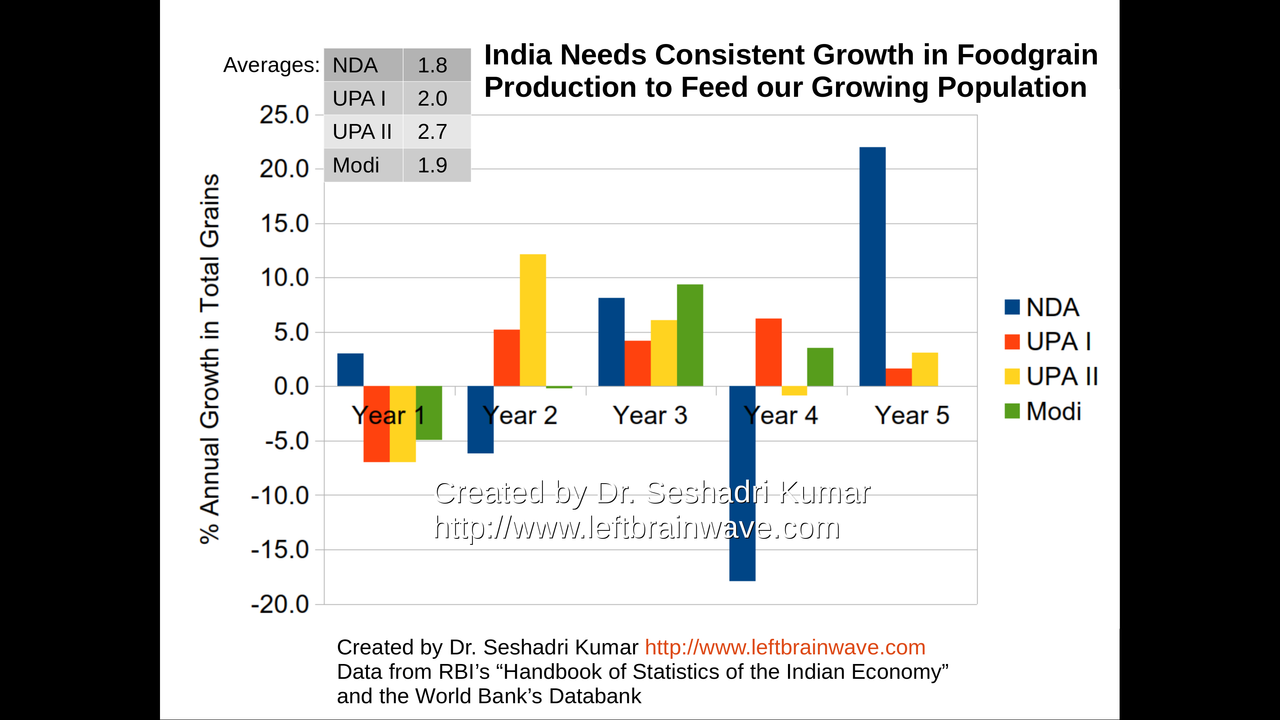
Annual Growth in Total Foodgrain Production for Various Regimes
29 /120
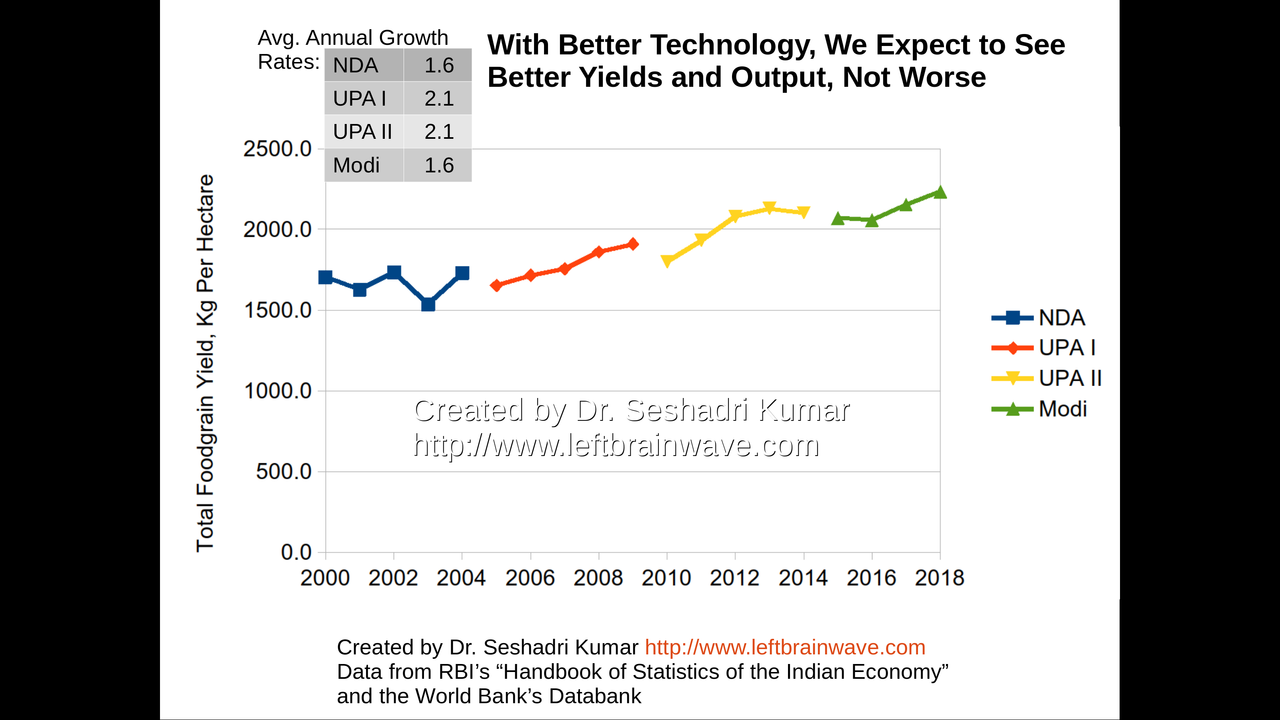
Growth in Foodgrain Yield for Different Regimes
30 / 120
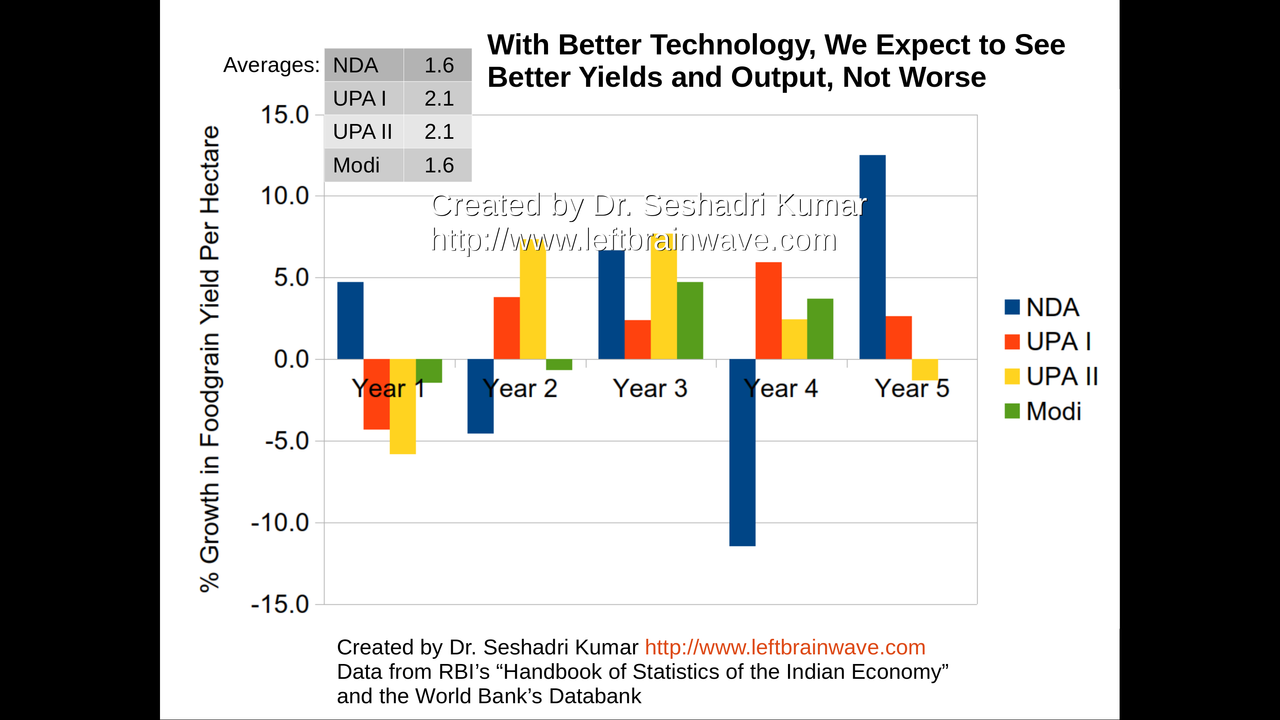
Growth in Foodgrain Yield for Different Regimes
31 / 120
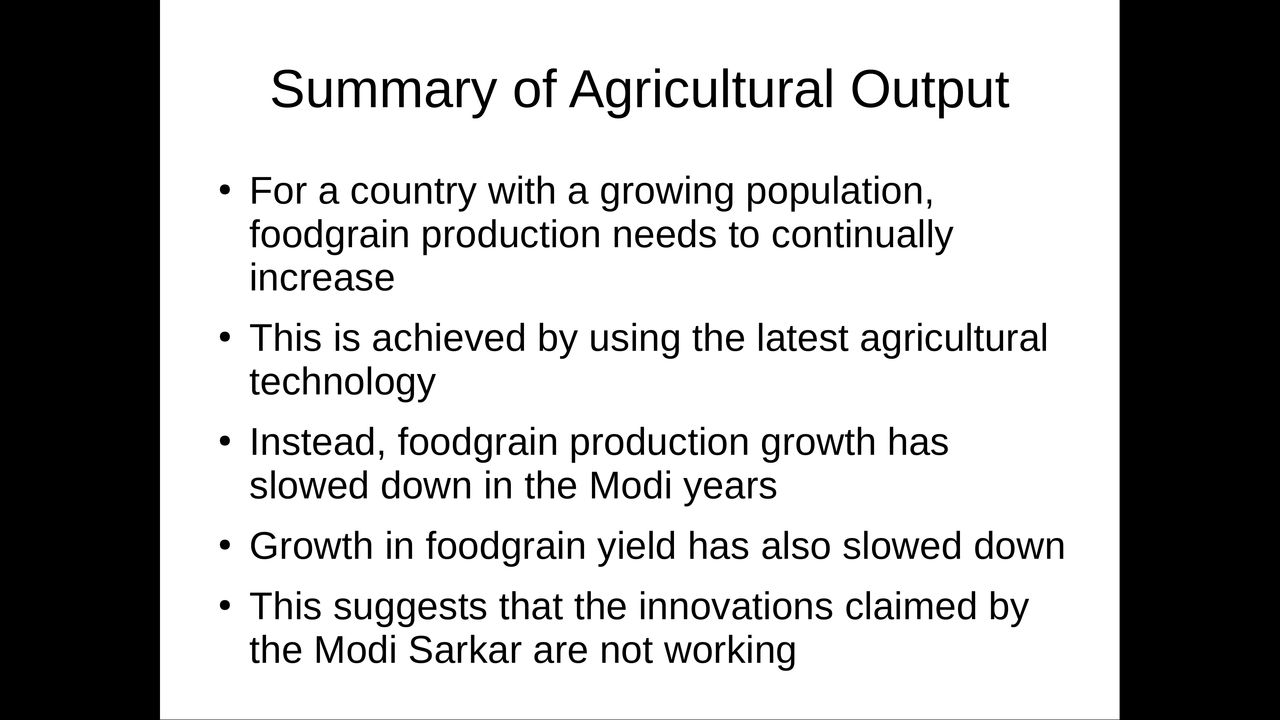
Summary: Agricultural Output Performance
32 / 120
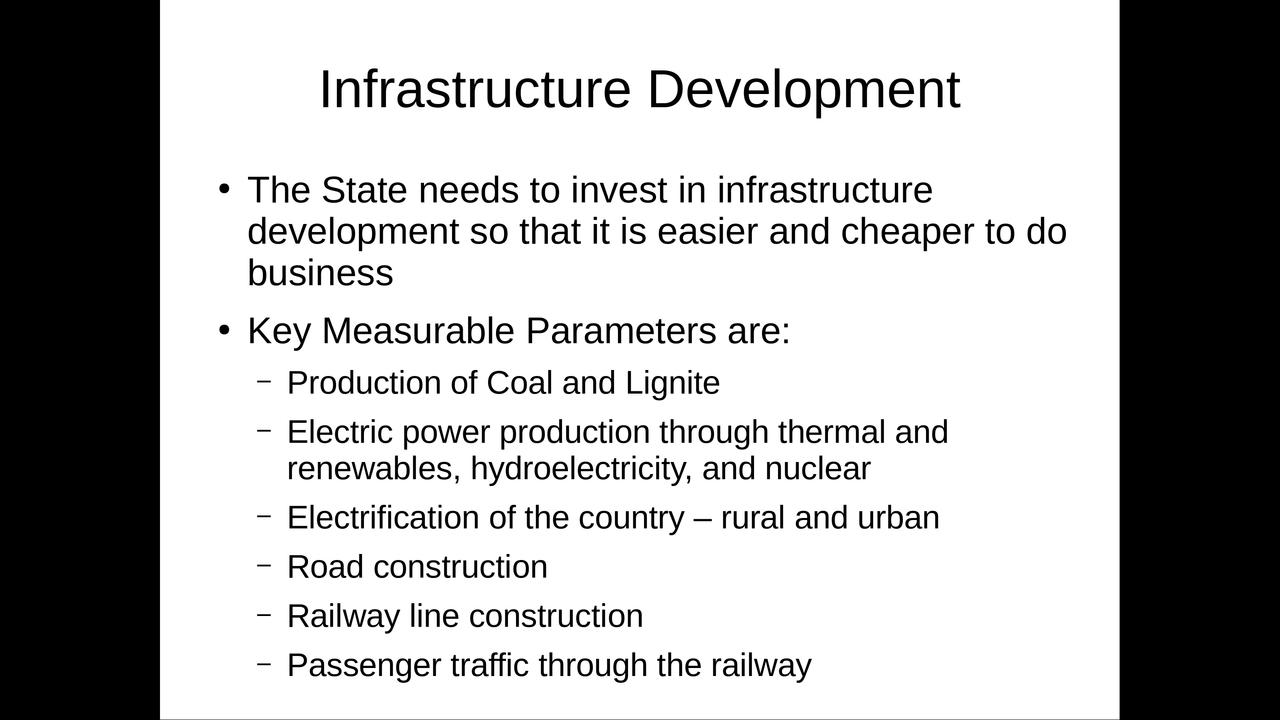
Infrastructure Development
33 / 120
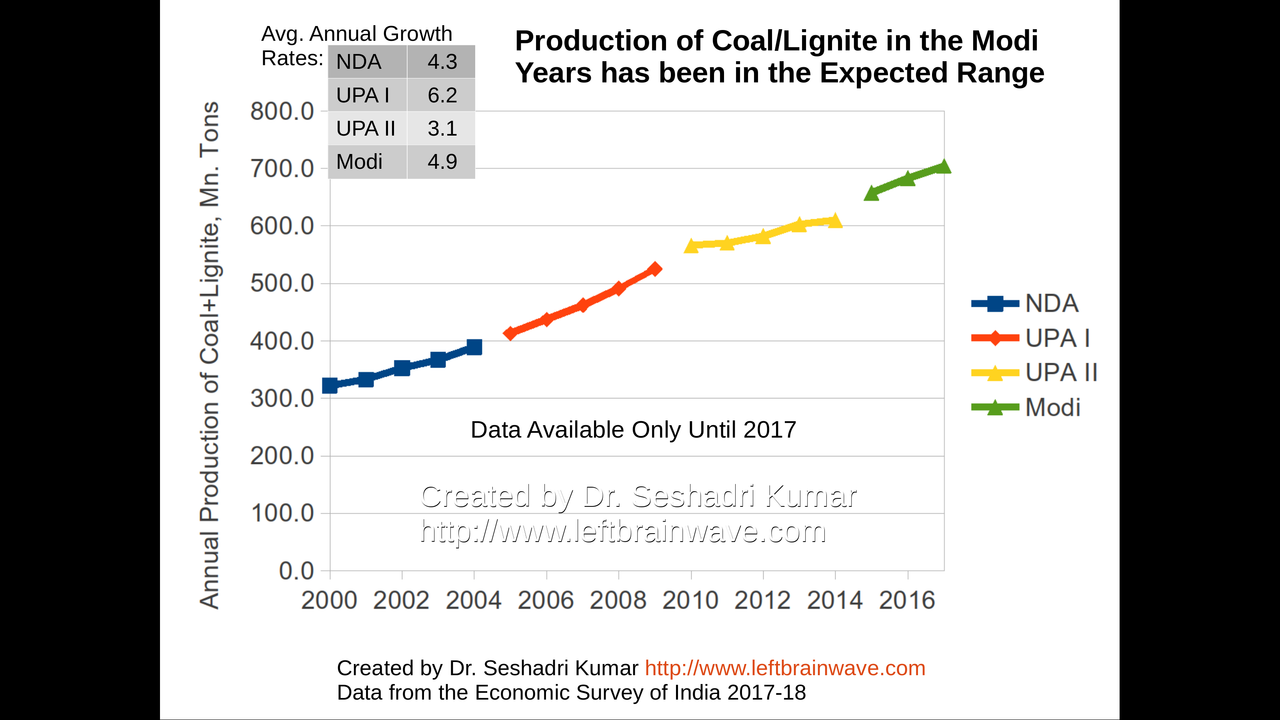
Growth in Production of Coal and Lignite
34 / 120
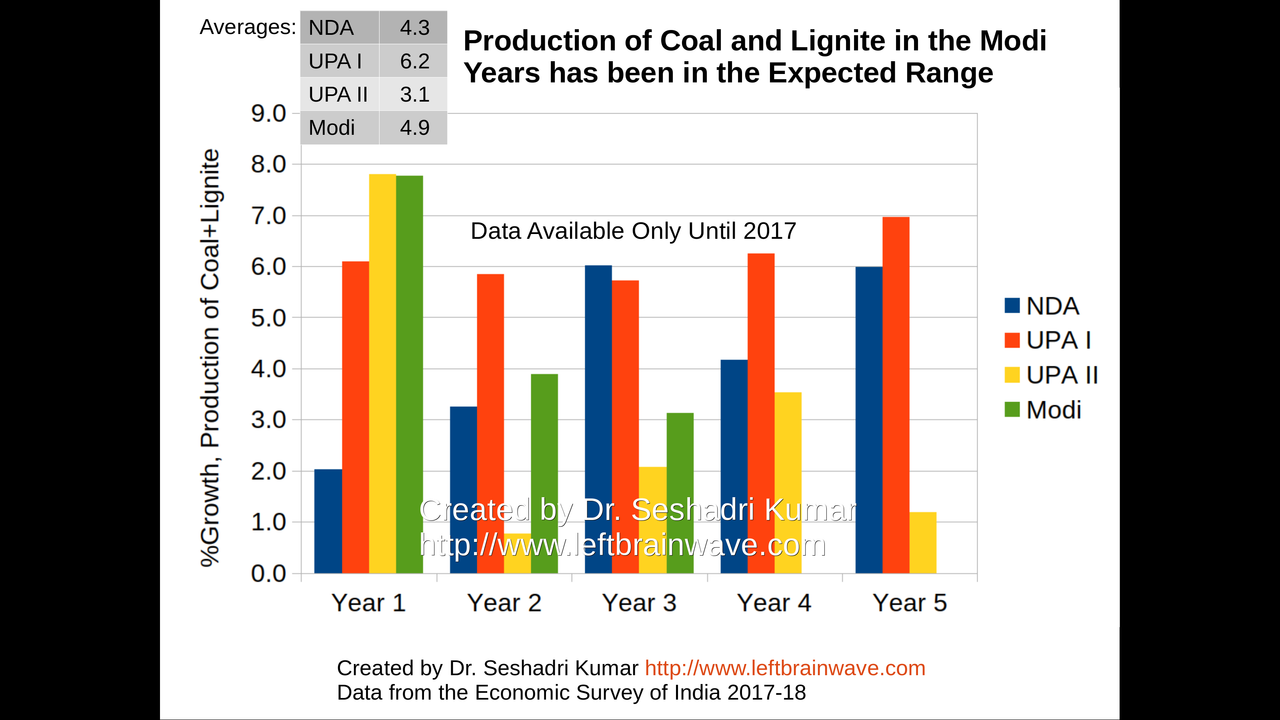
Growth in Production of Coal and Lignite
35 / 120
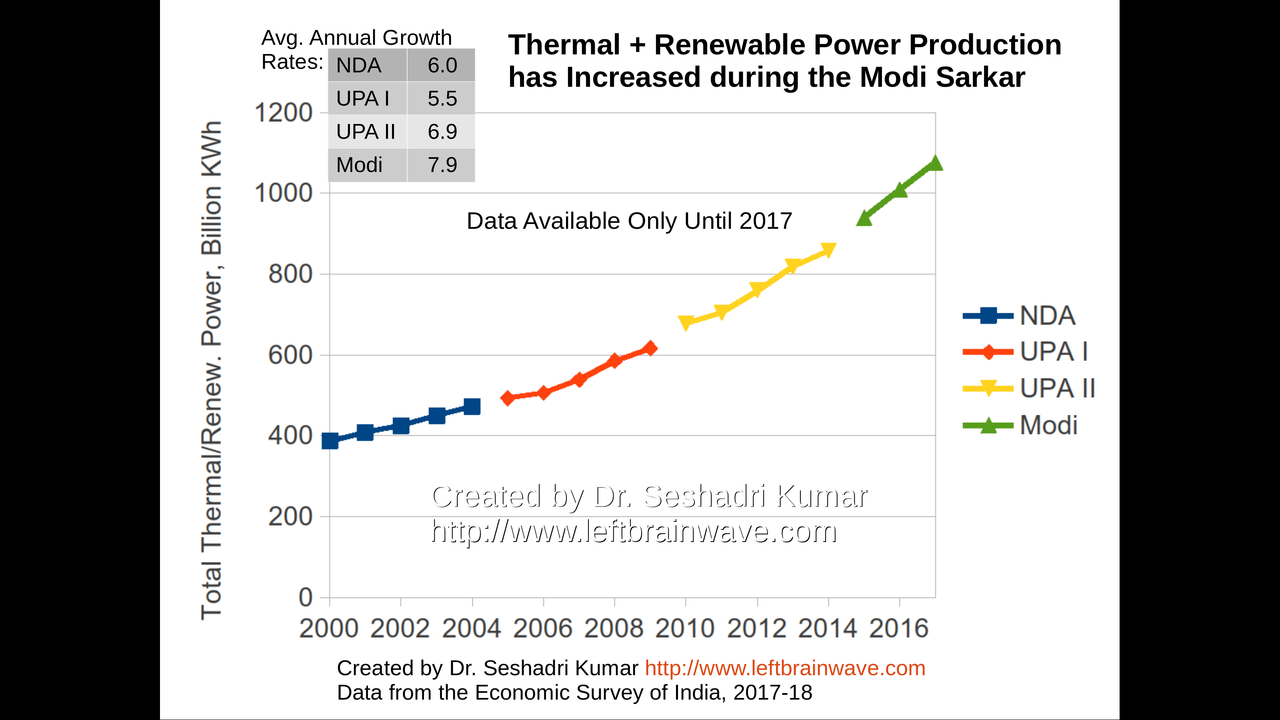
Growth in Thermal and Renewable Power Generation
36 / 120
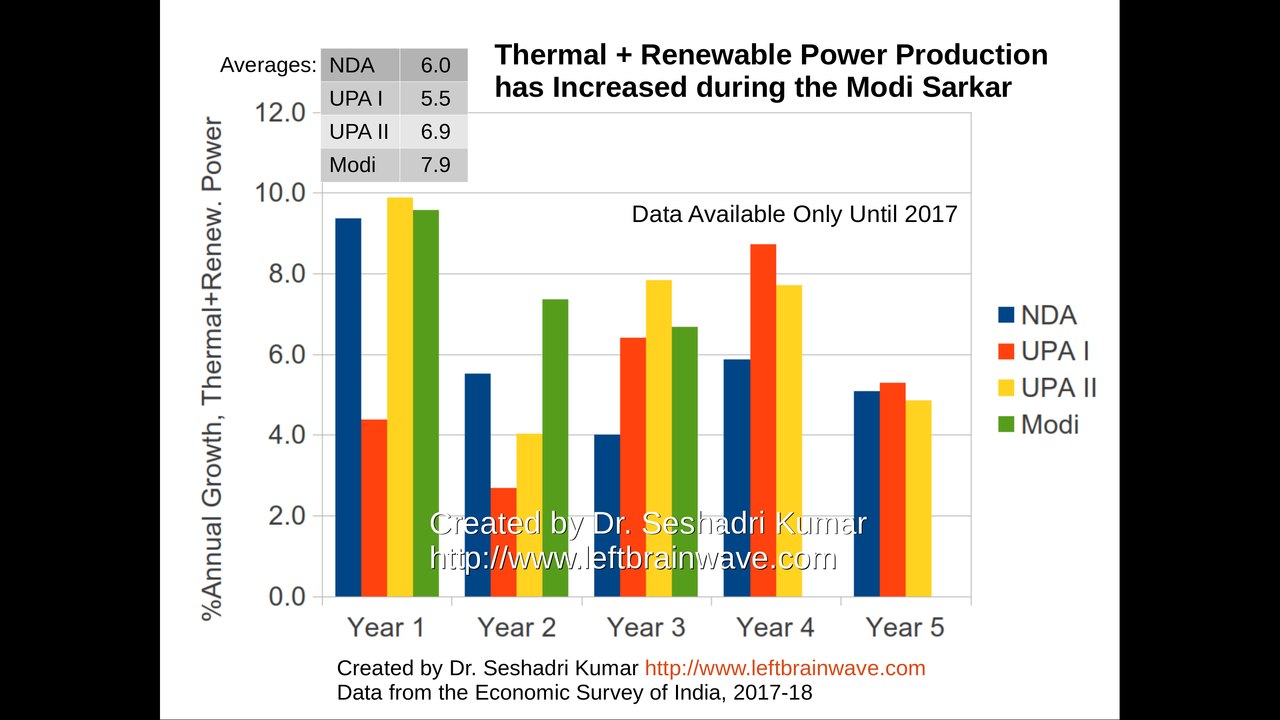
Growth in Thermal and Renewable Power Generation
37 / 120
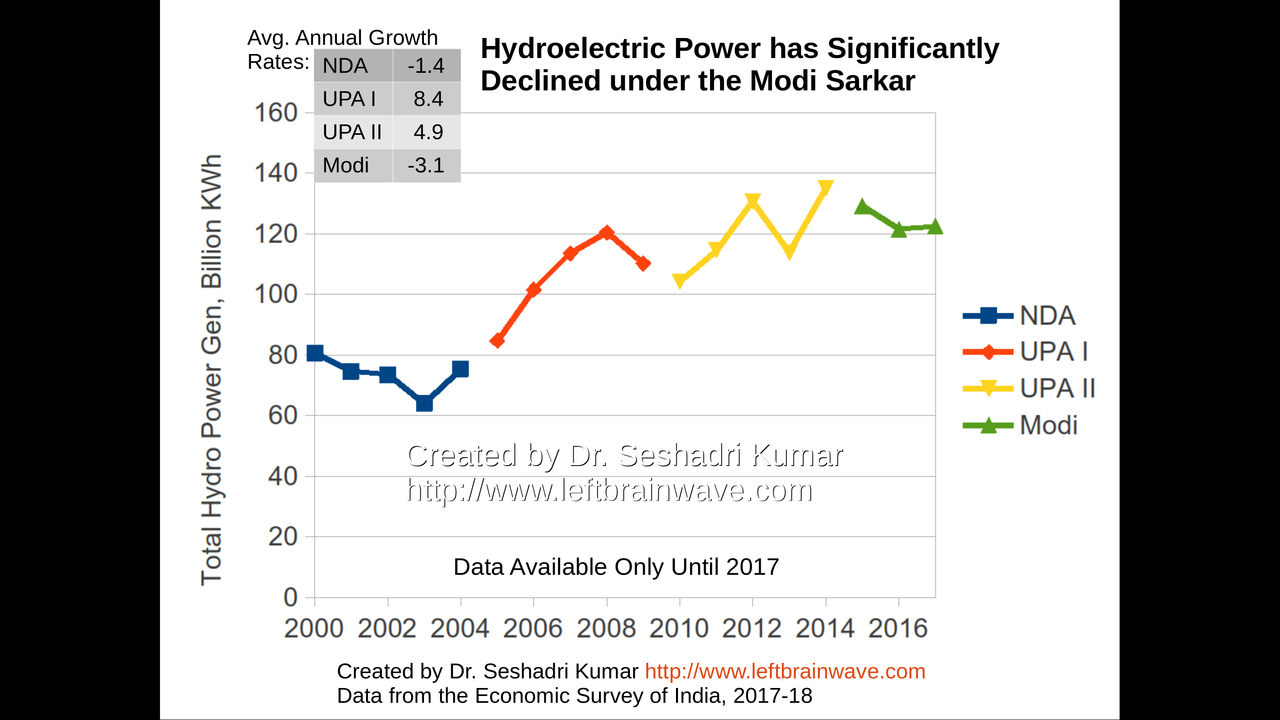
Growth in Hydroelectric Power Generation
38 / 120
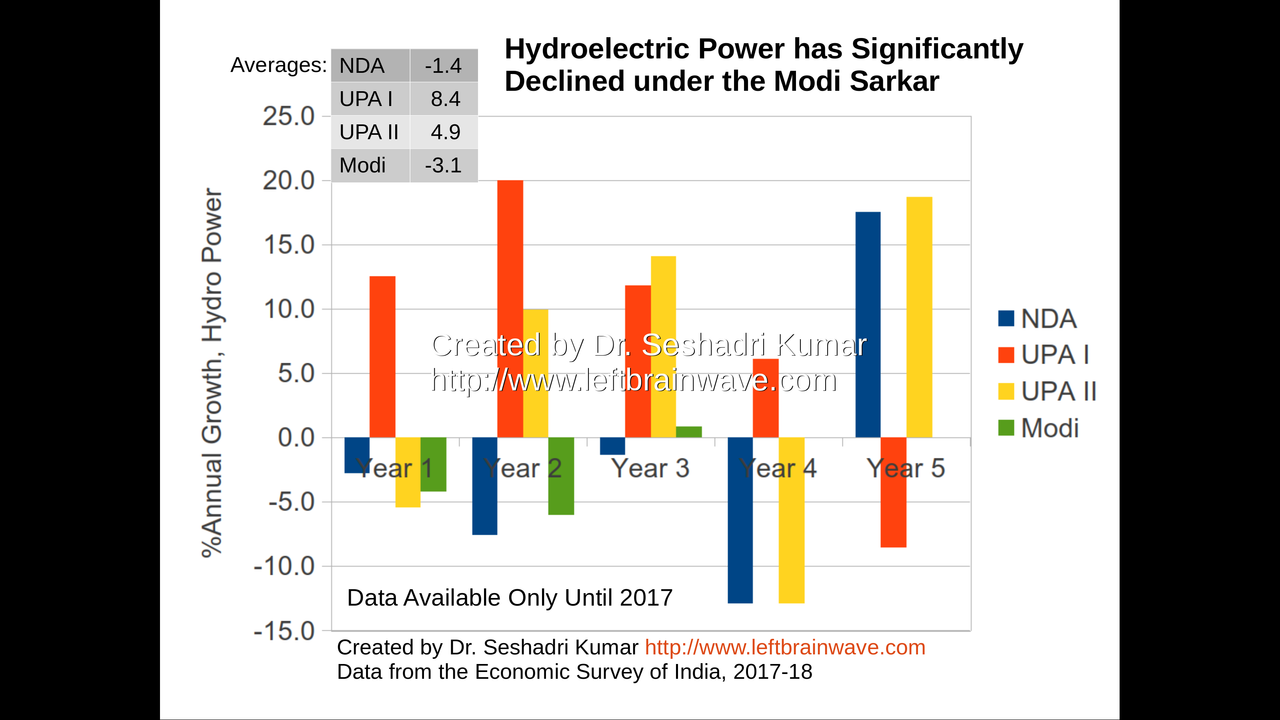
Growth in Hydroelectric Power Generation
39 / 120
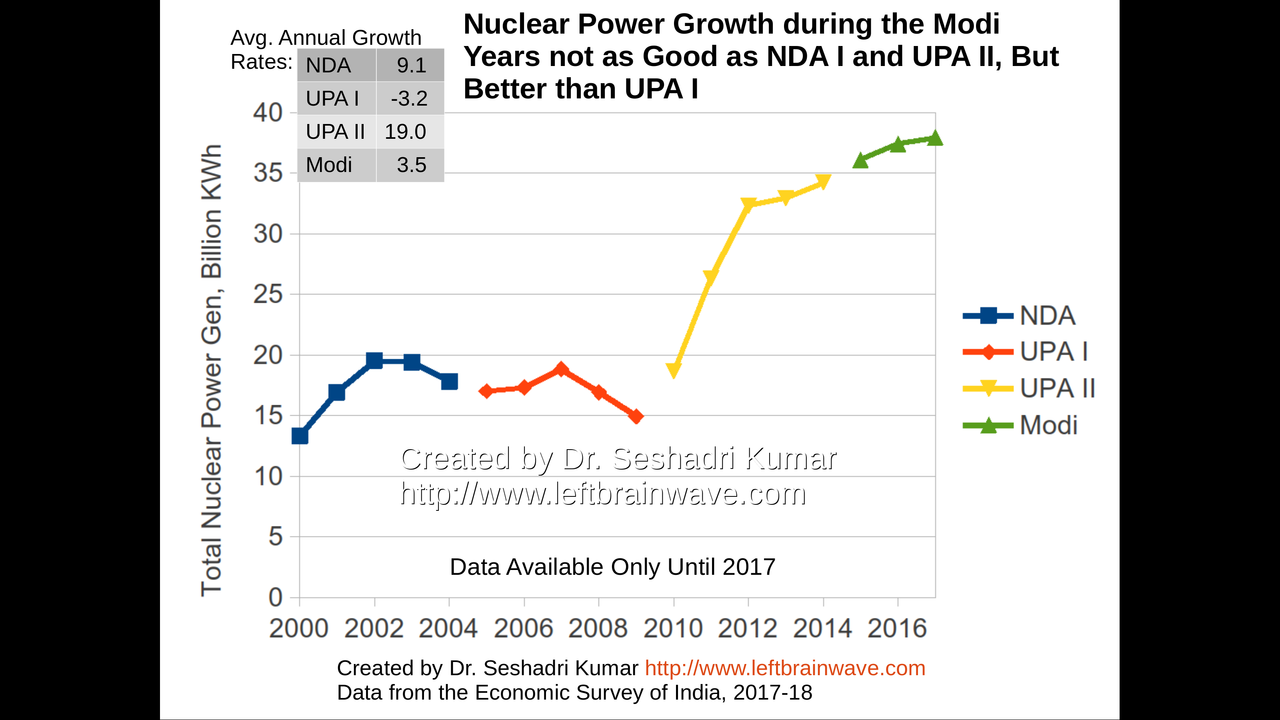
Growth in Nuclear Power Generation
40 / 120

Growth in Nuclear Power Generation
41 / 120
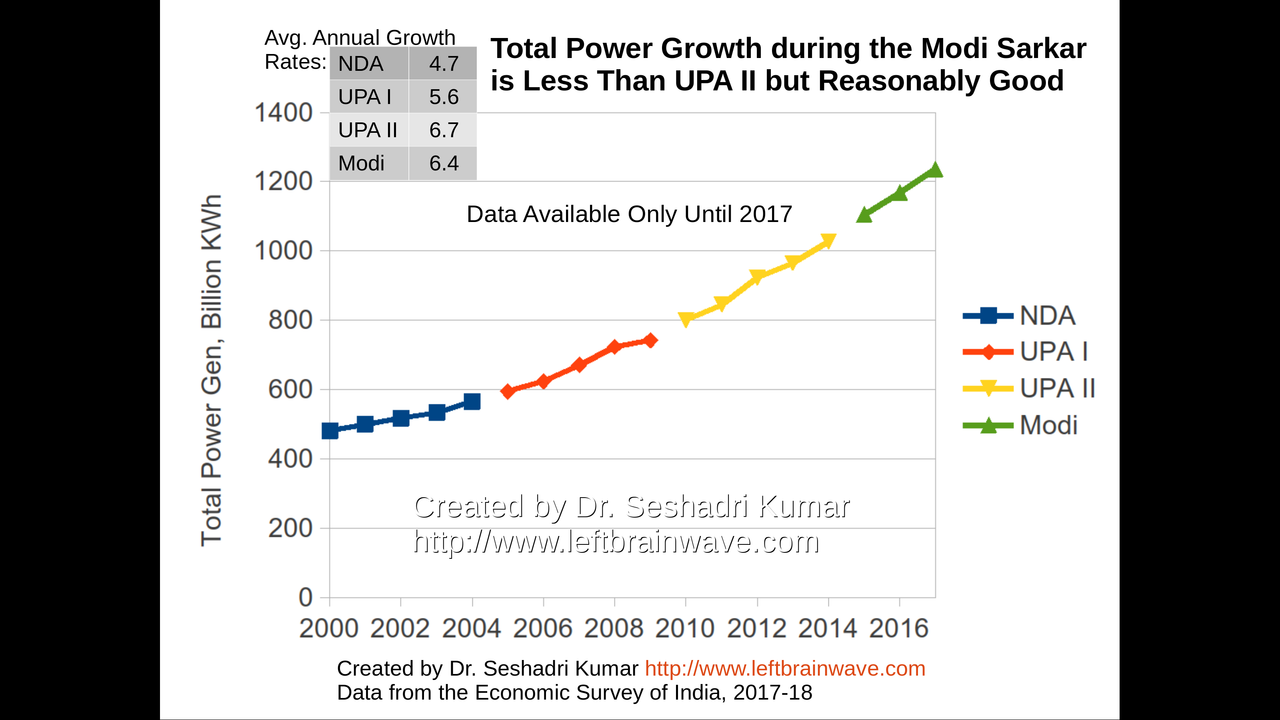
Growth in Total Power Generation
42 / 120
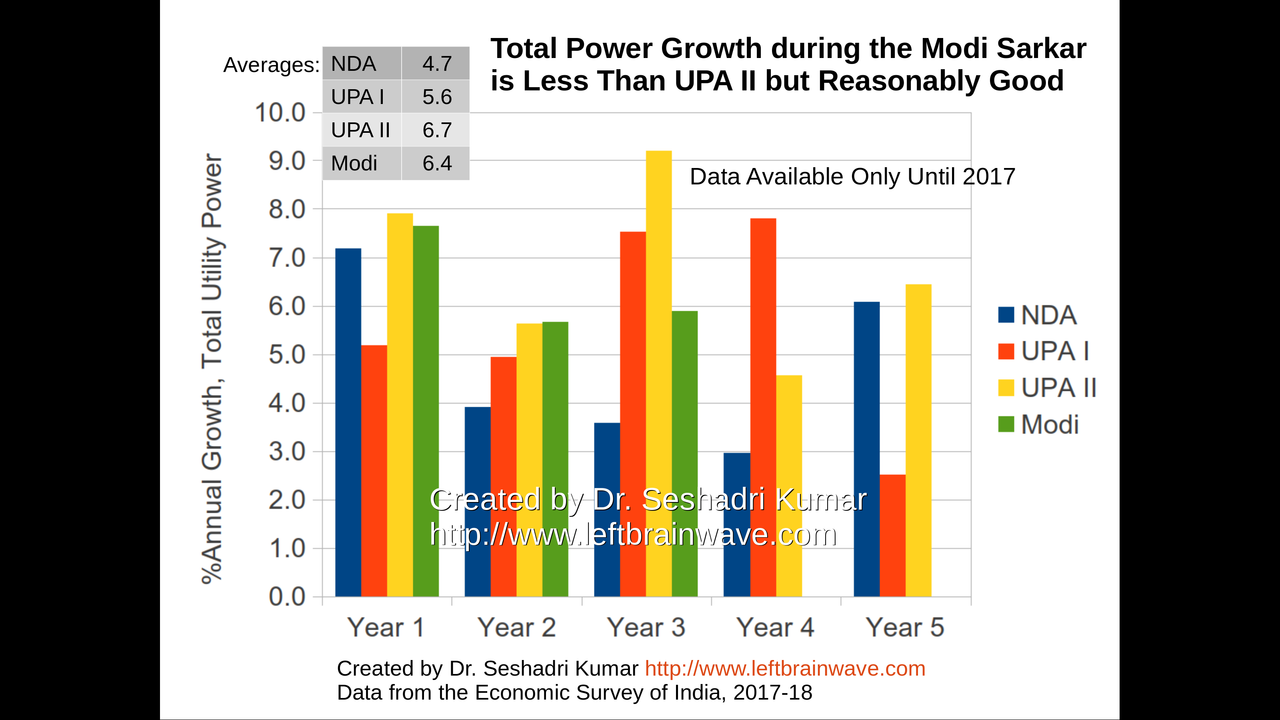
Growth in Total Power Generation
43 / 120
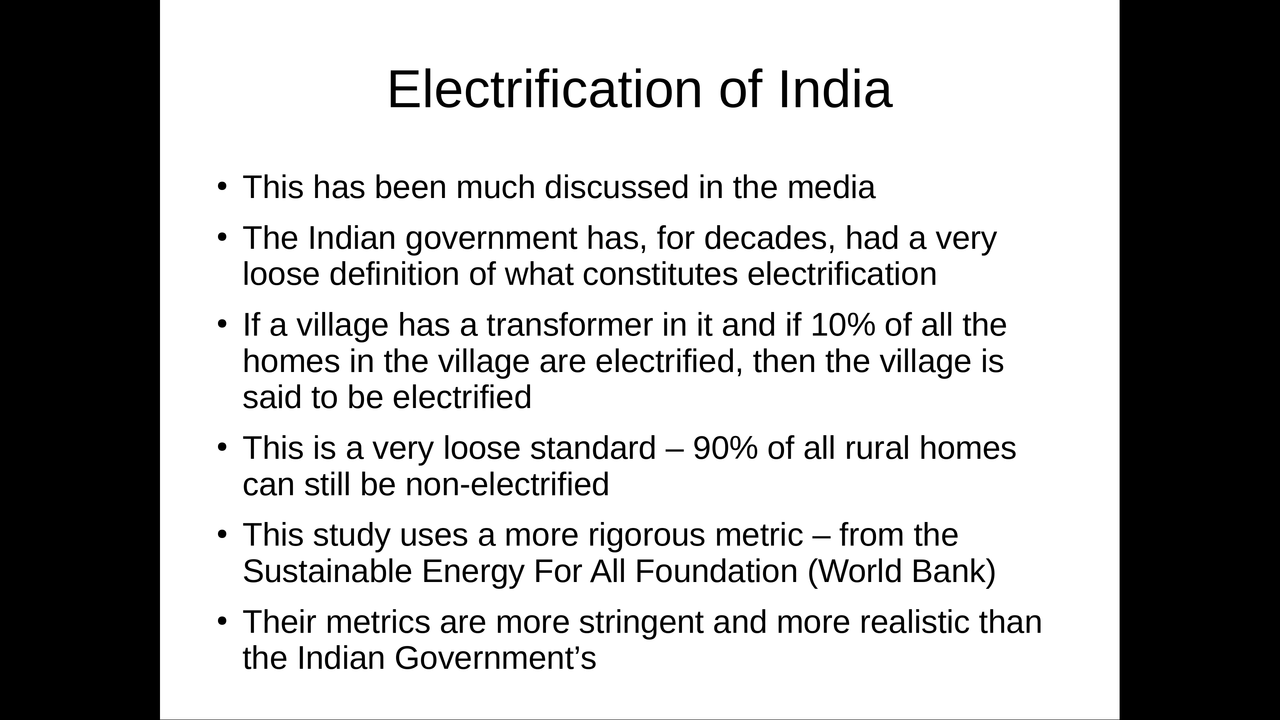
Rural and Urban Electrification
44 / 120
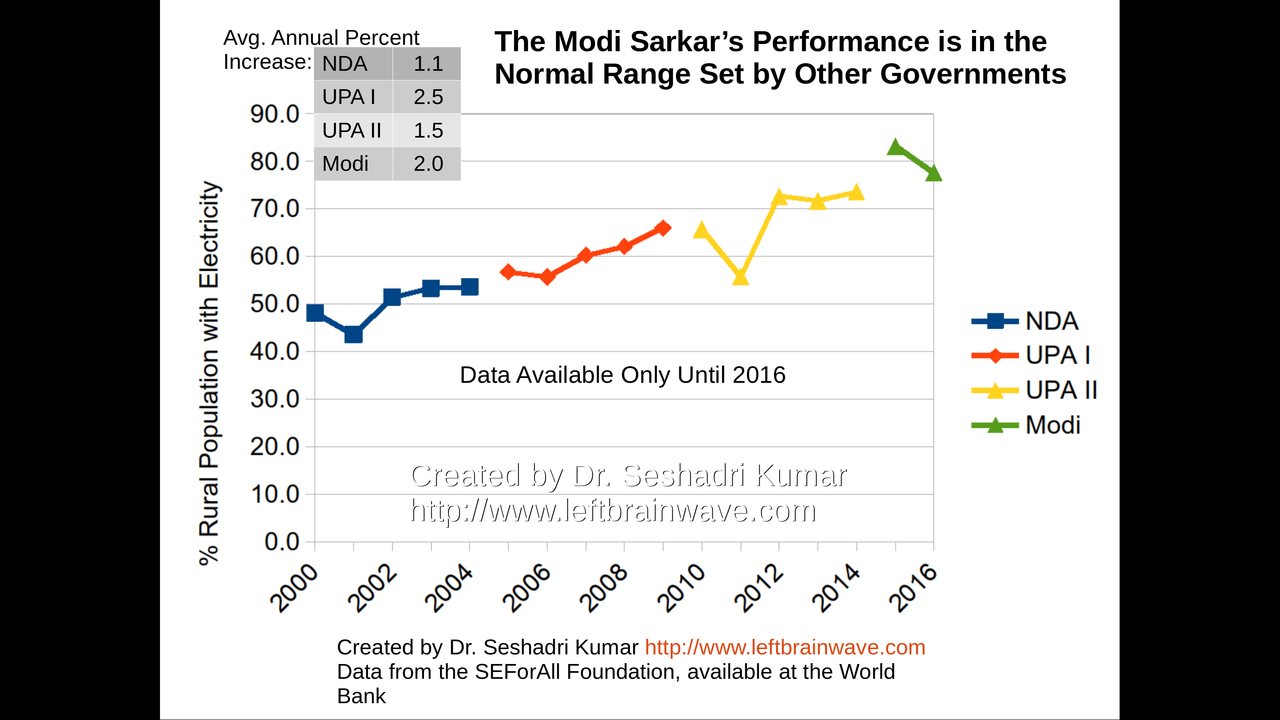
Growth in Rural Electrification
45 / 120
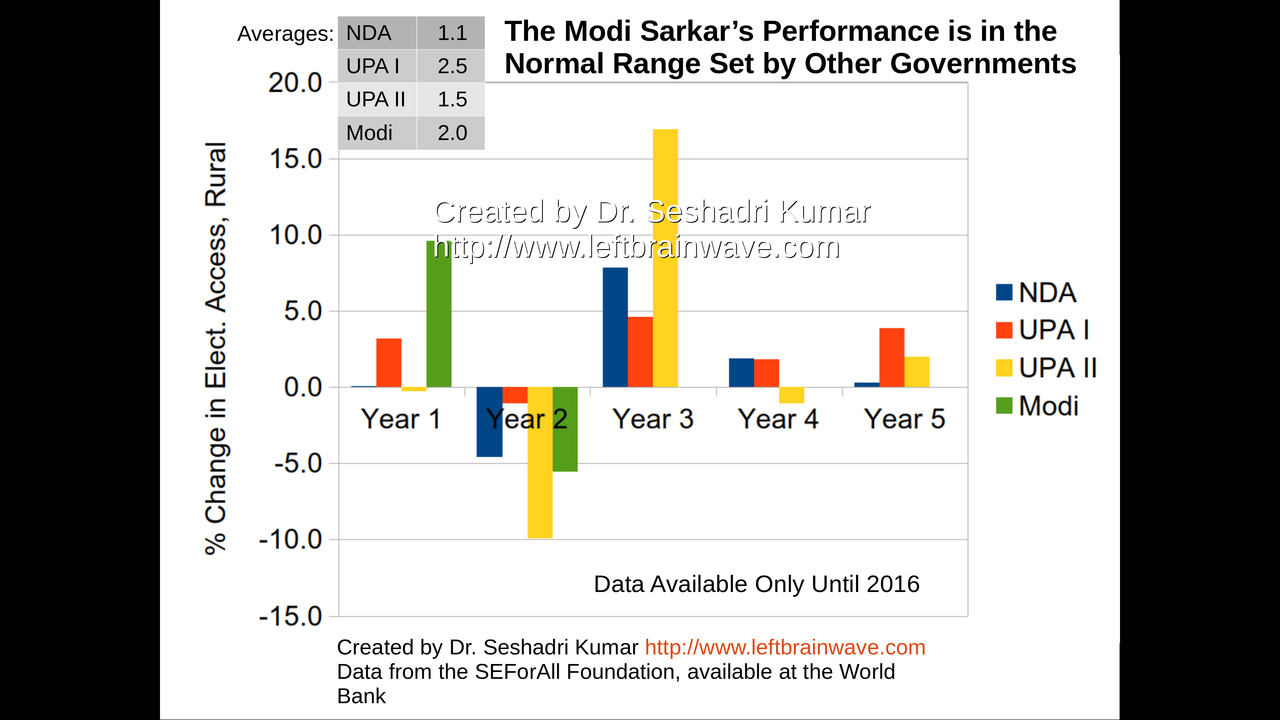
Growth in Rural Electrification
46 / 120
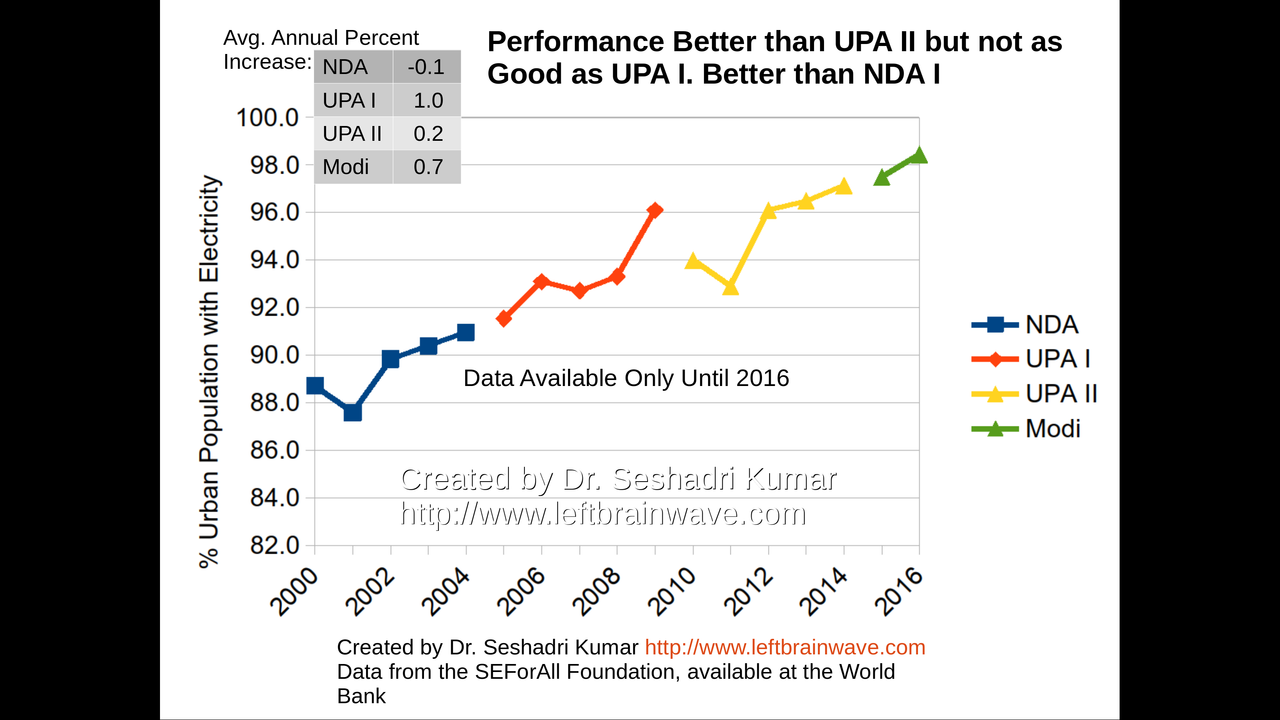
Growth in Urban Electrification
47 / 120

Growth in Urban Electrification
48 / 120
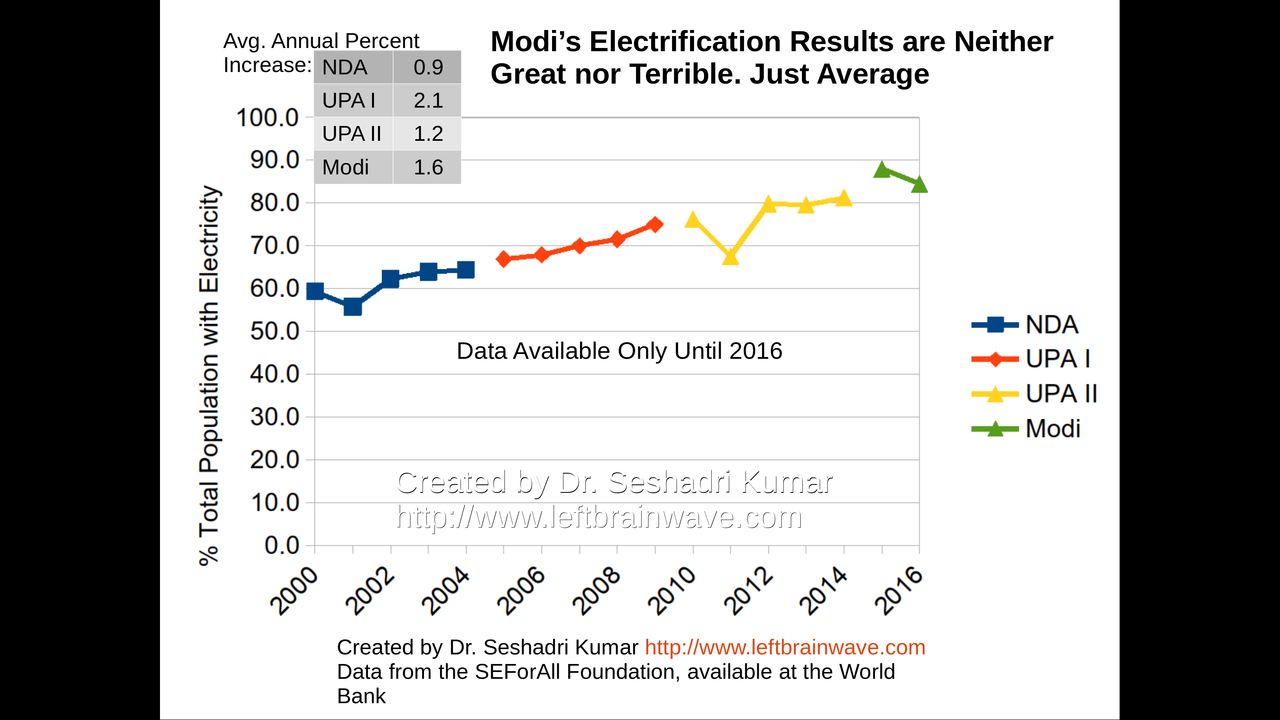
Growth in Overall Electrification
49 / 120
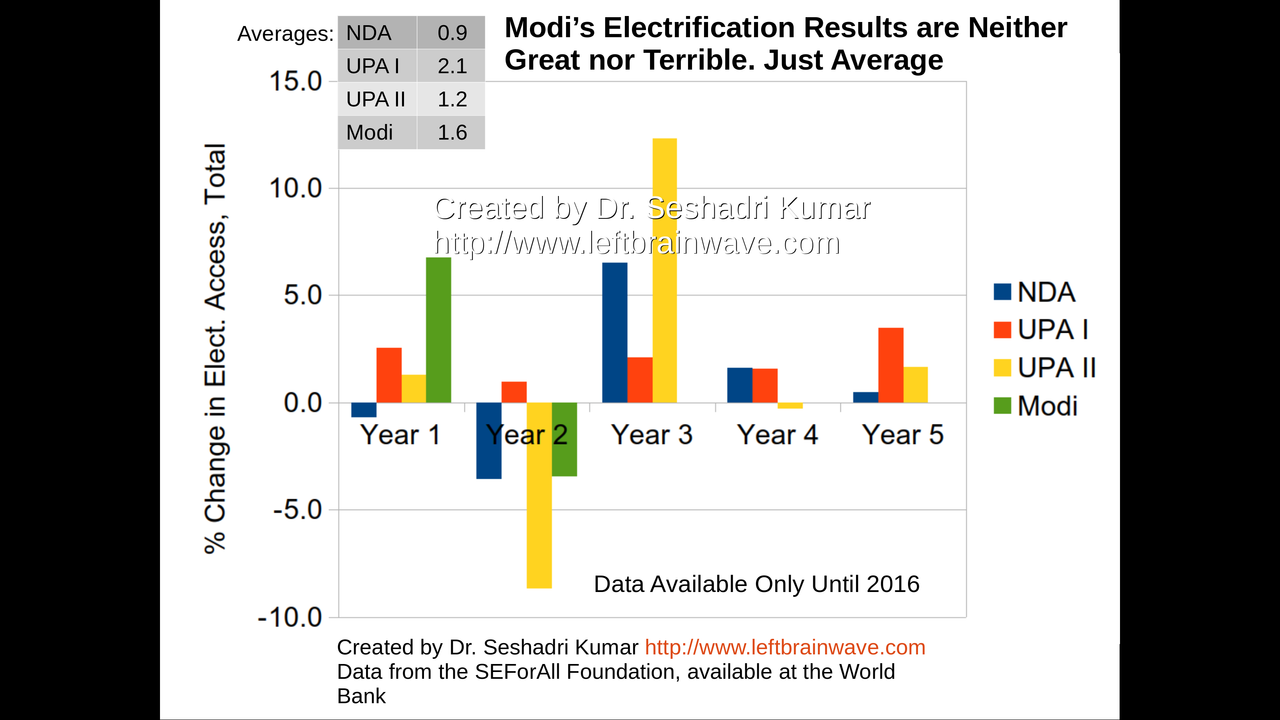
Growth in Overall Electrification
50 / 120
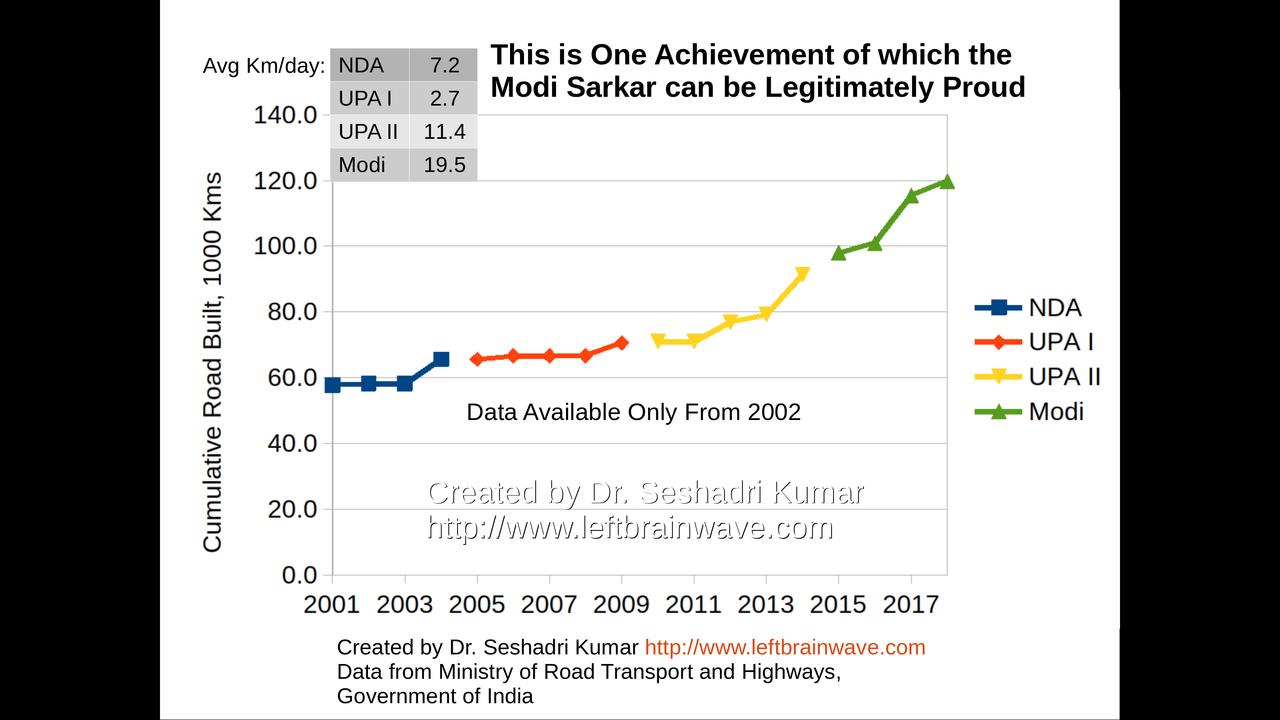
Average Road Km Built Per Day
51 / 120
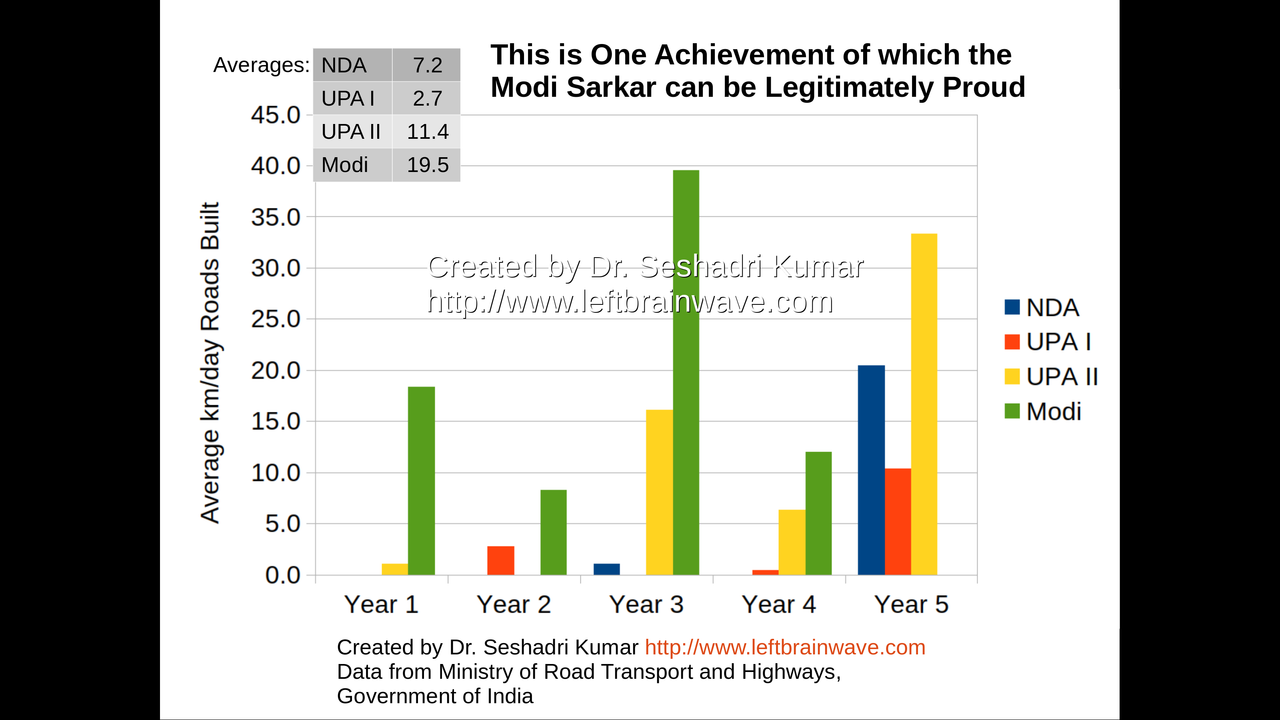
Average Road Km Built Per Day
52 / 120
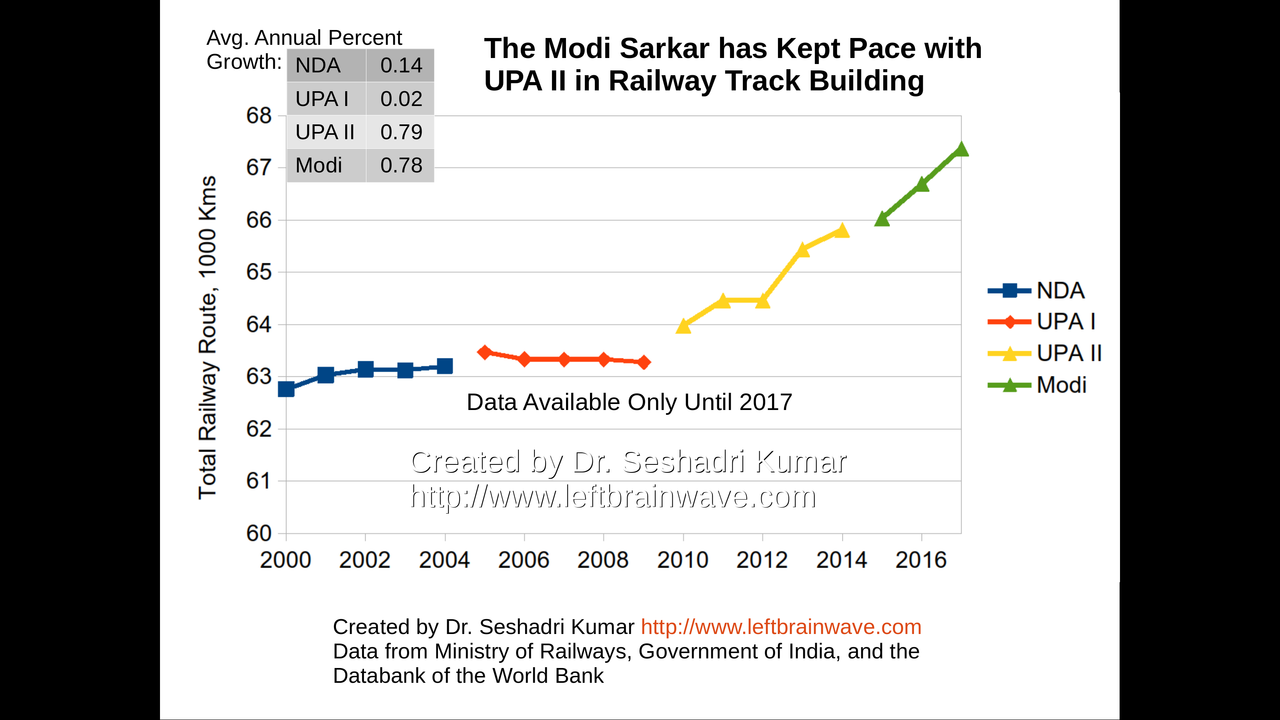
Growth in Railway Track Length
53 / 120
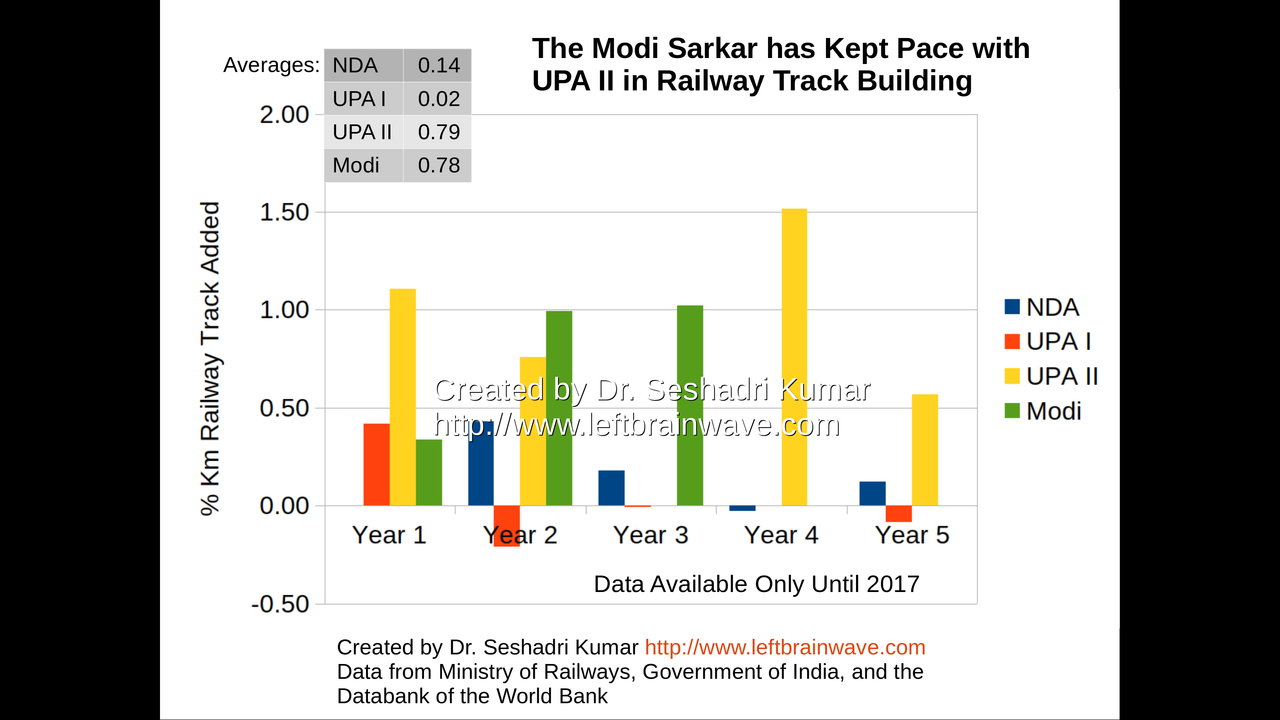
Growth in Railway Track Length
54 / 120
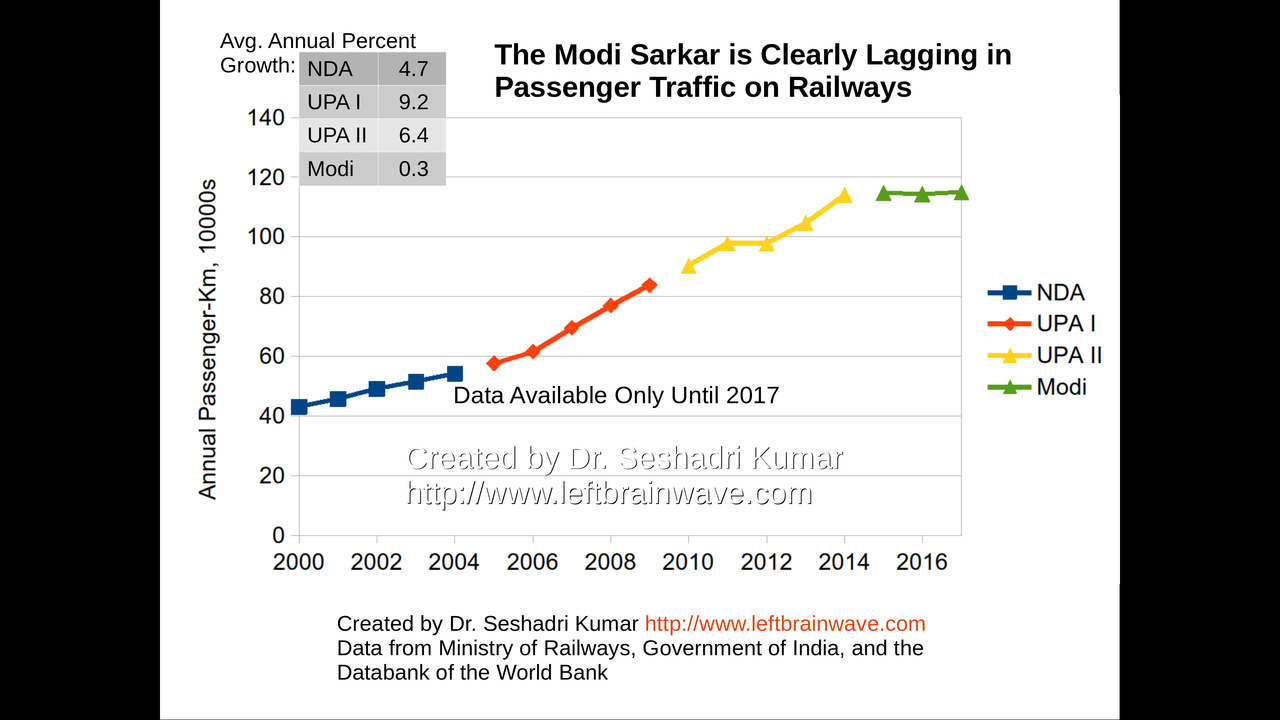
Growth in Passenger Traffic
55 / 120
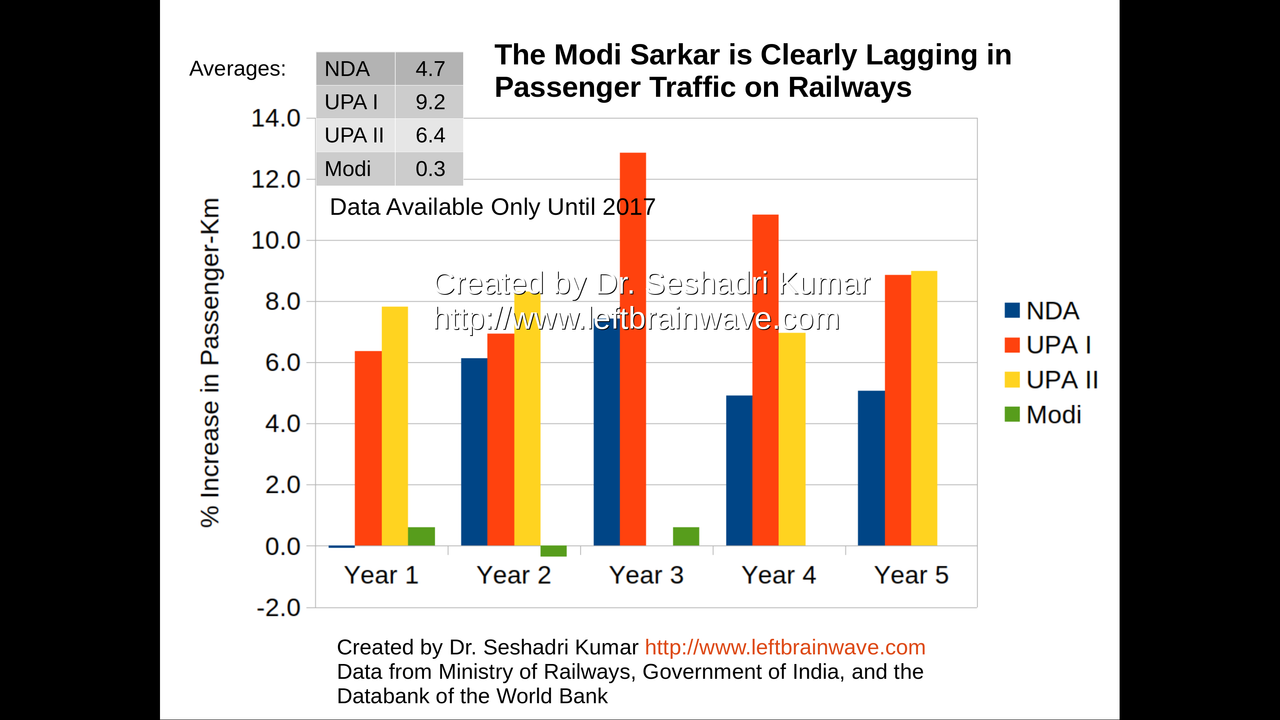
Growth in Passenger Traffic
56 / 120
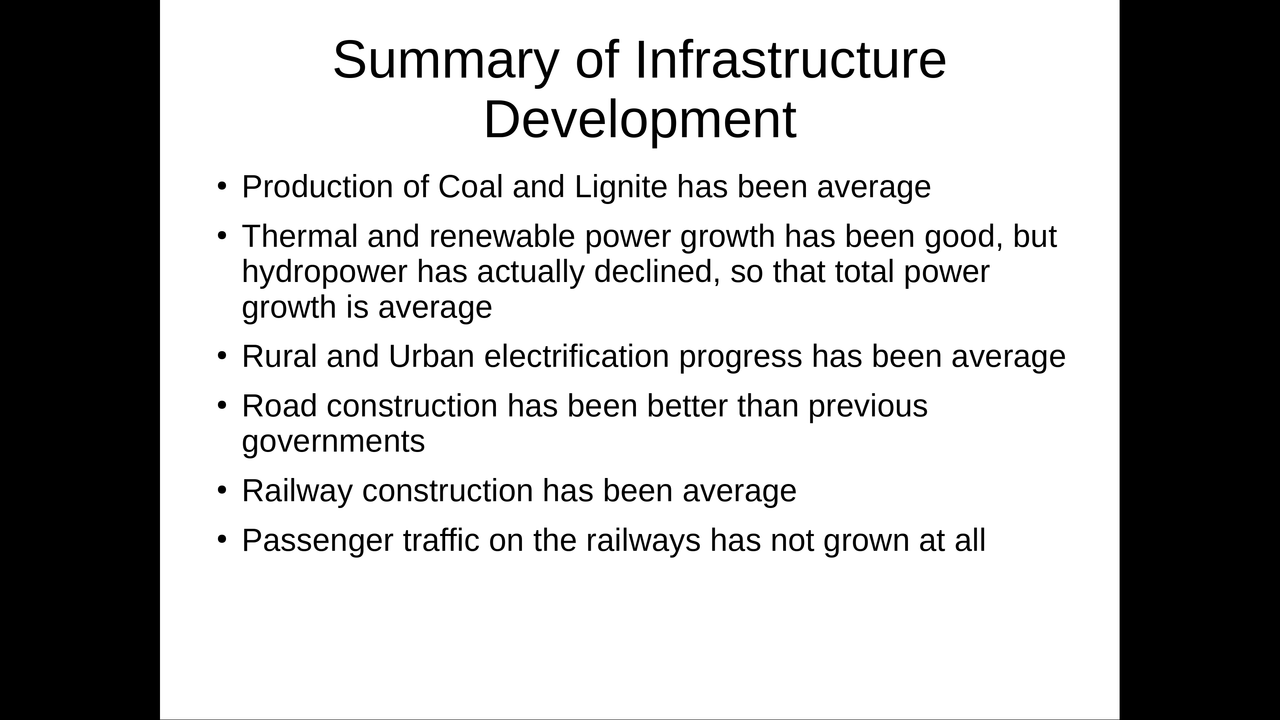
Summary: Infrastructure Development Comparison
57 / 120
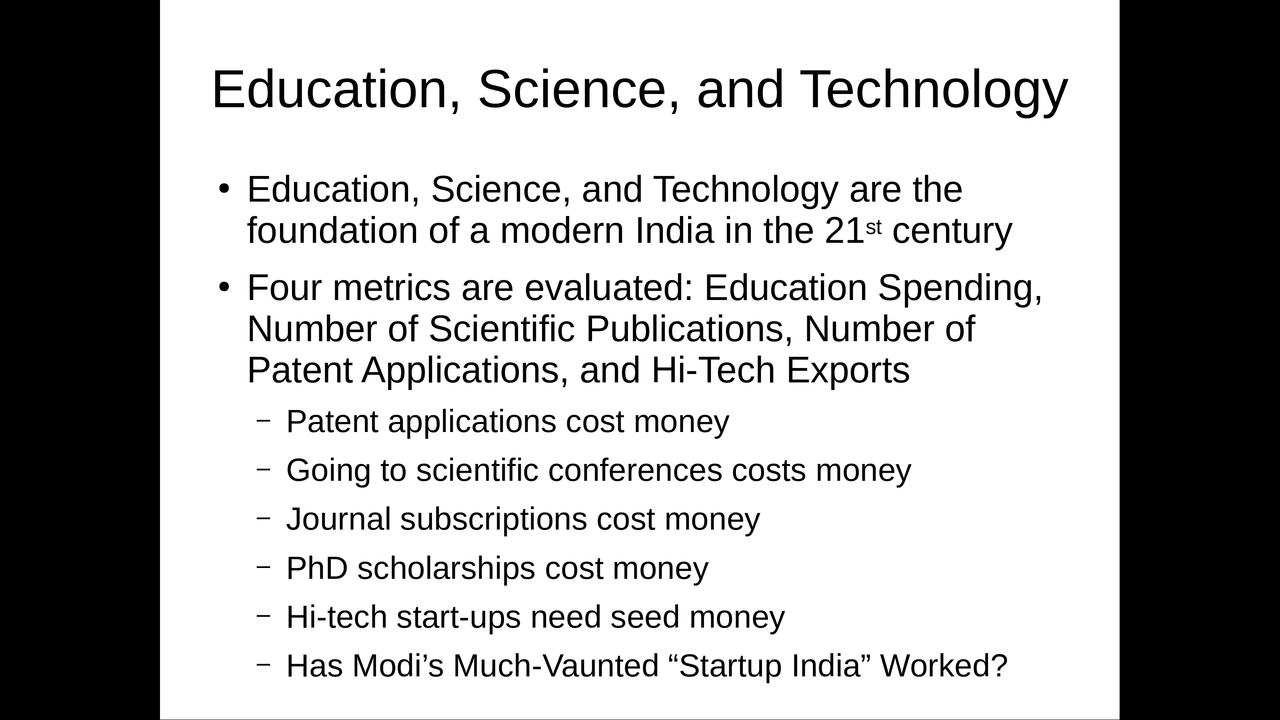
Education, Science, and Technology
58 / 120
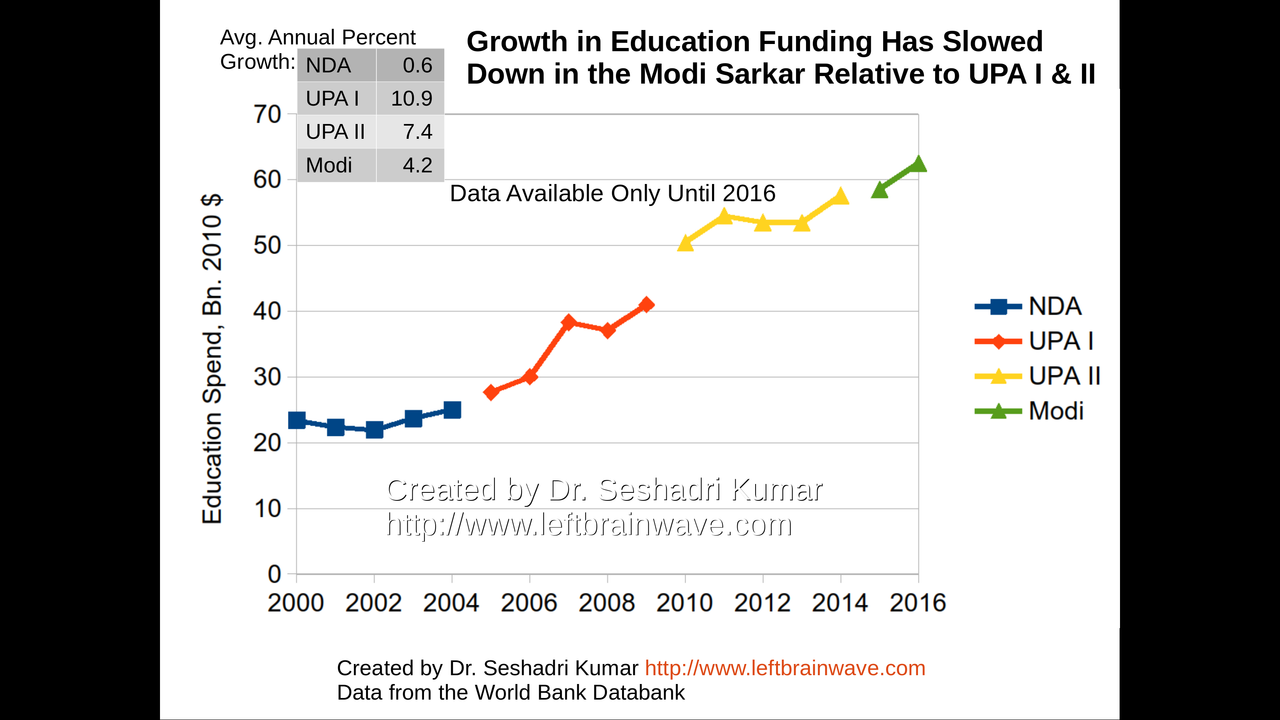
Growth in Education Funding
59 / 120
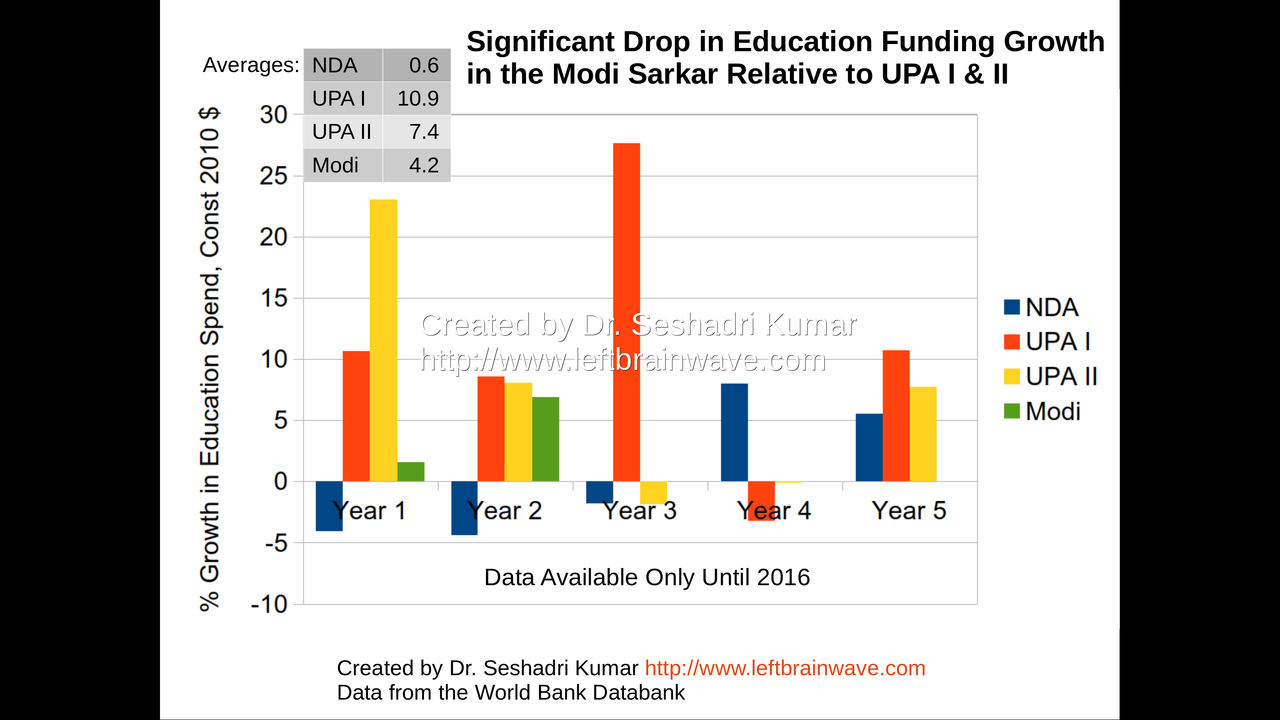
Growth in Education Funding
60 / 120
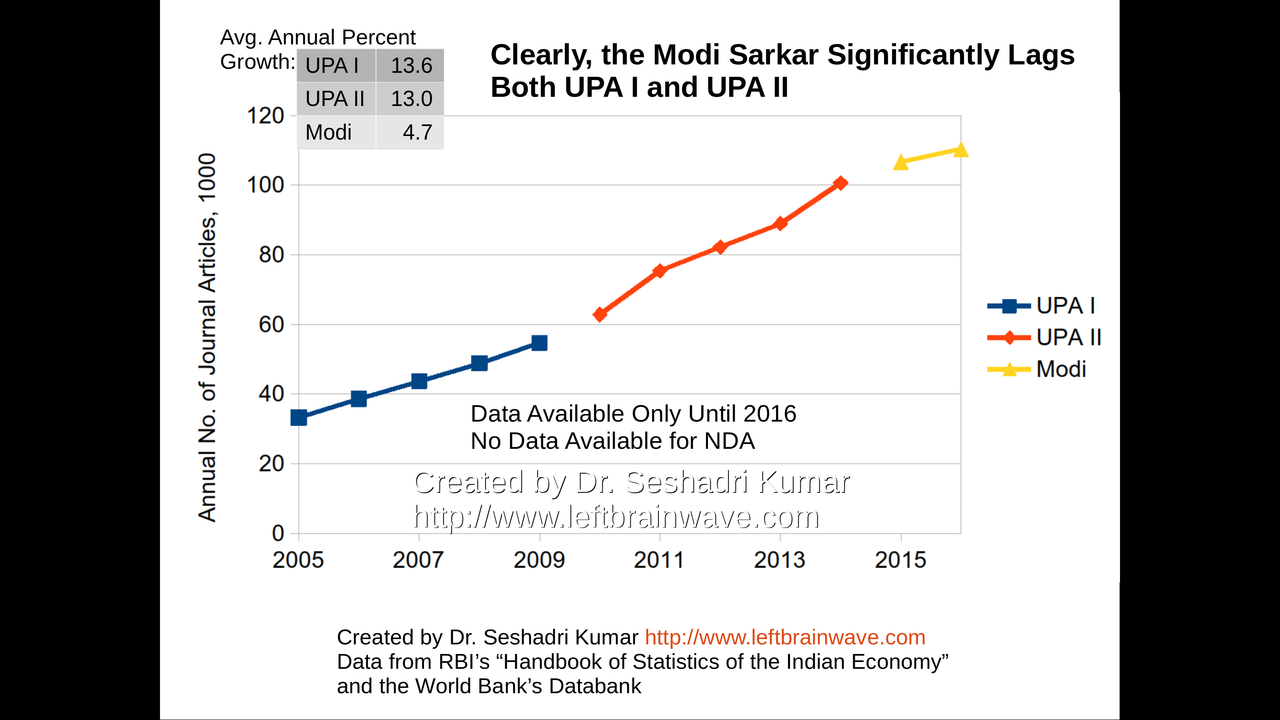
Growth in Number of Scientific and Technical Articles
61 / 120
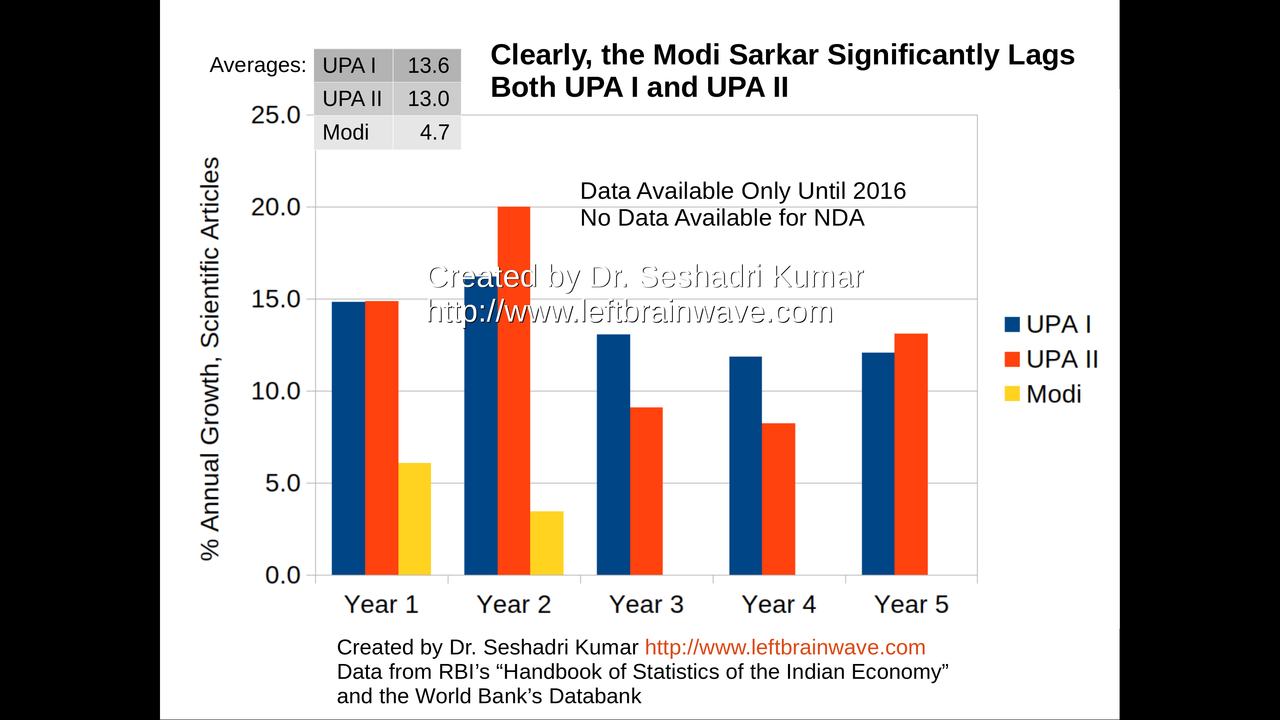
Growth in Number of Scientific and Technical Articles
62 / 120
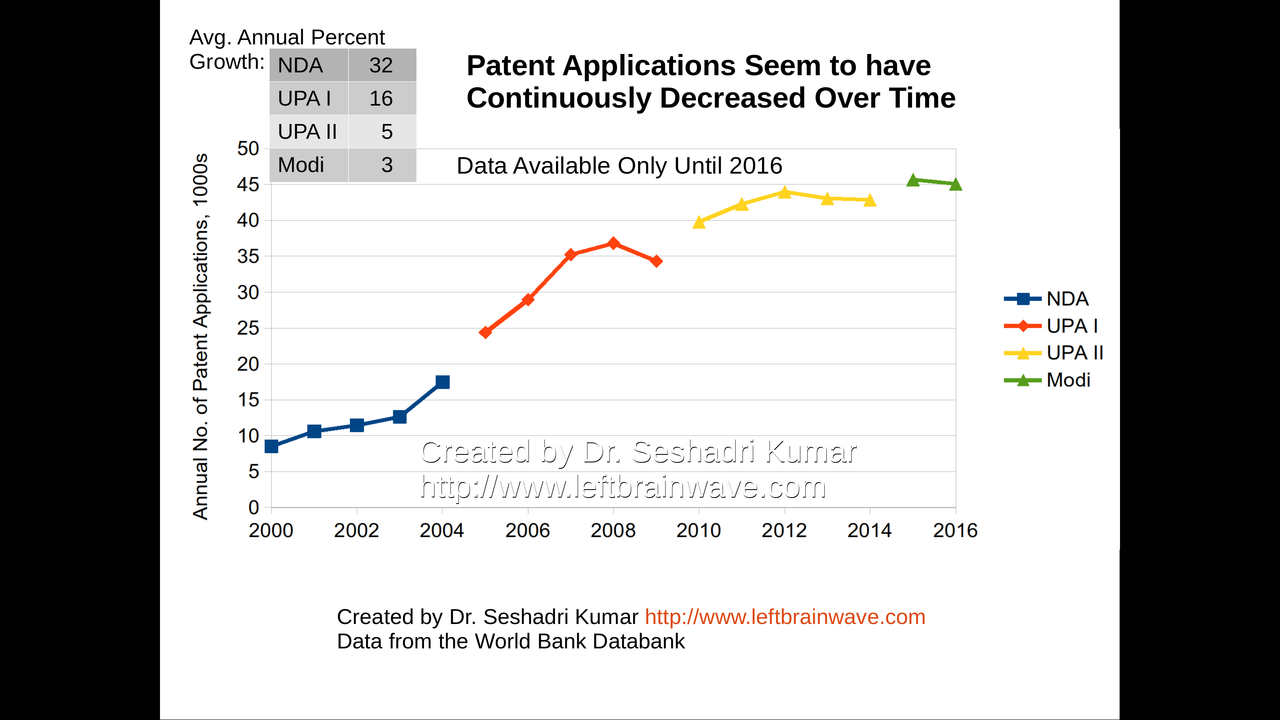
Growth in Number of Patent Applications
63 / 120
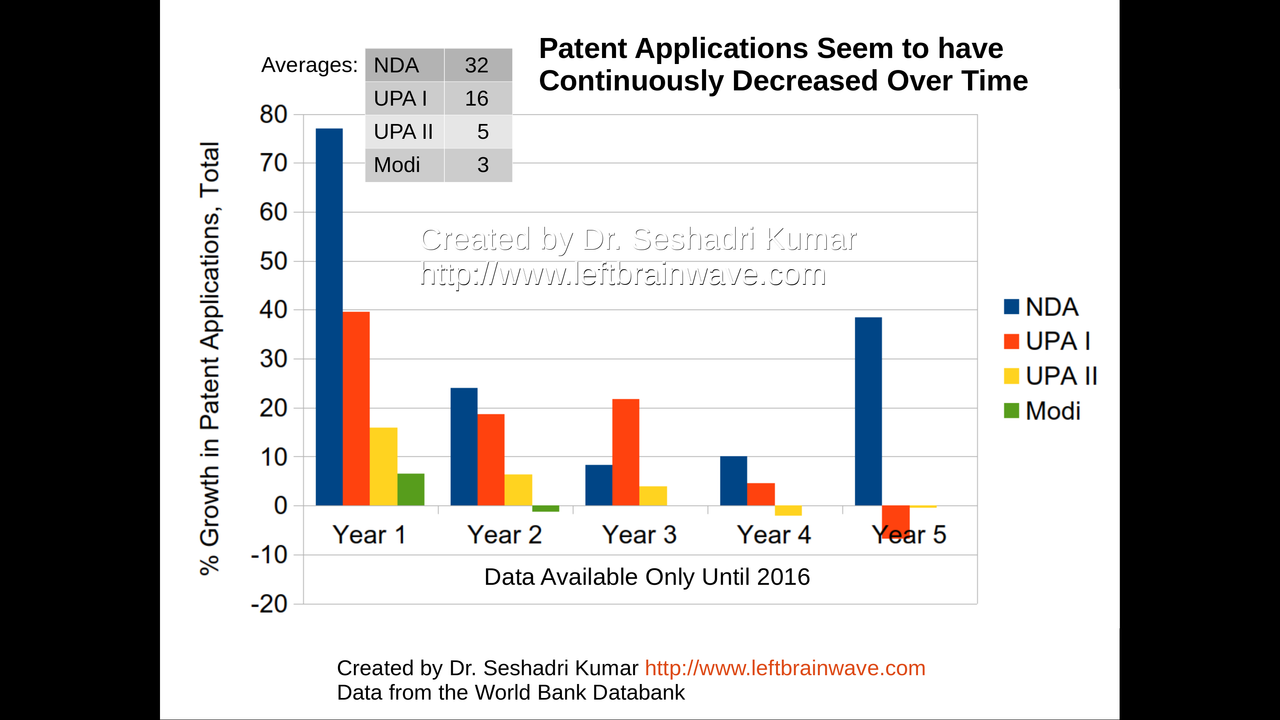
Growth in Number of Patent Applications
64 / 120
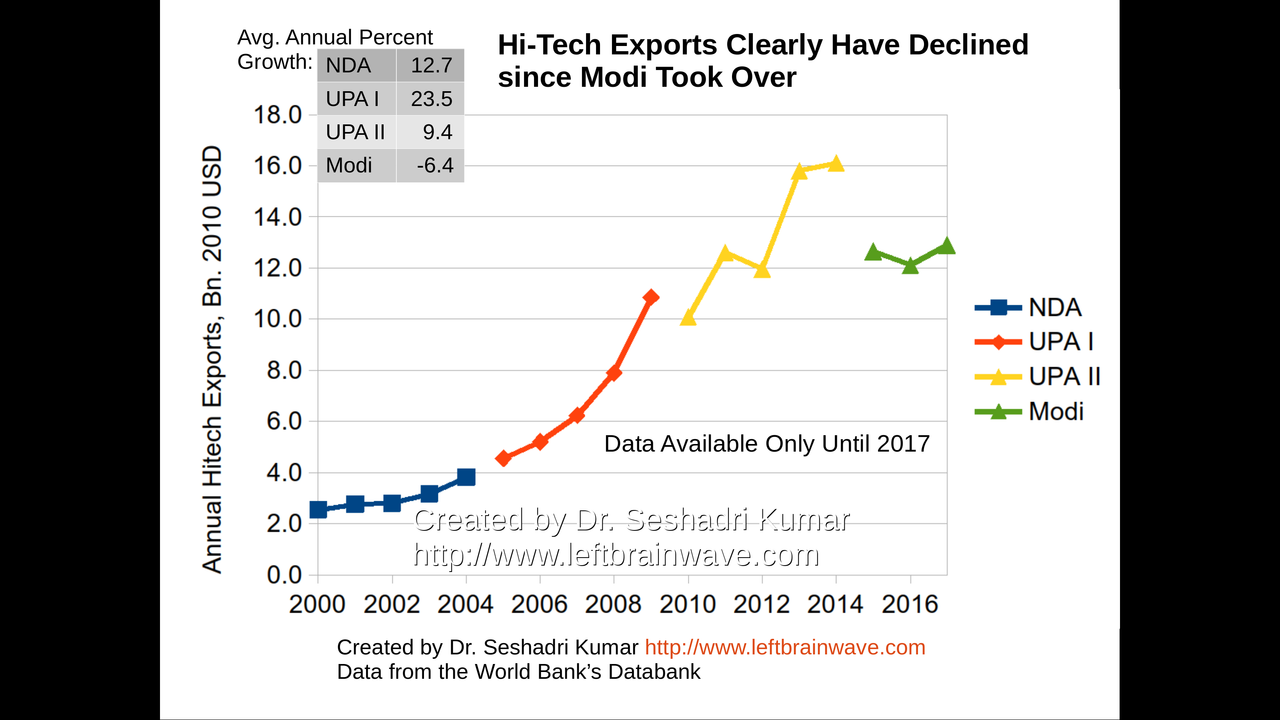
Growth in Hi-Tech Exports
65 / 120
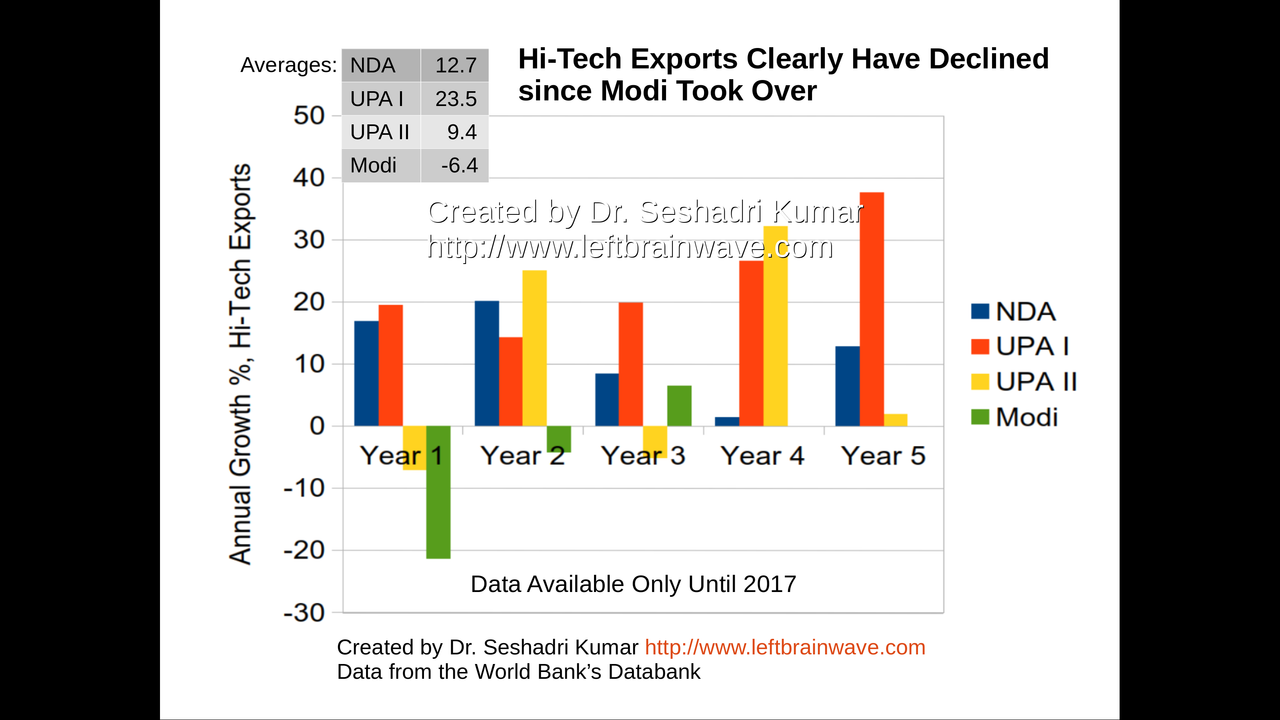
Growth in Hi-Tech Exports
66 / 120
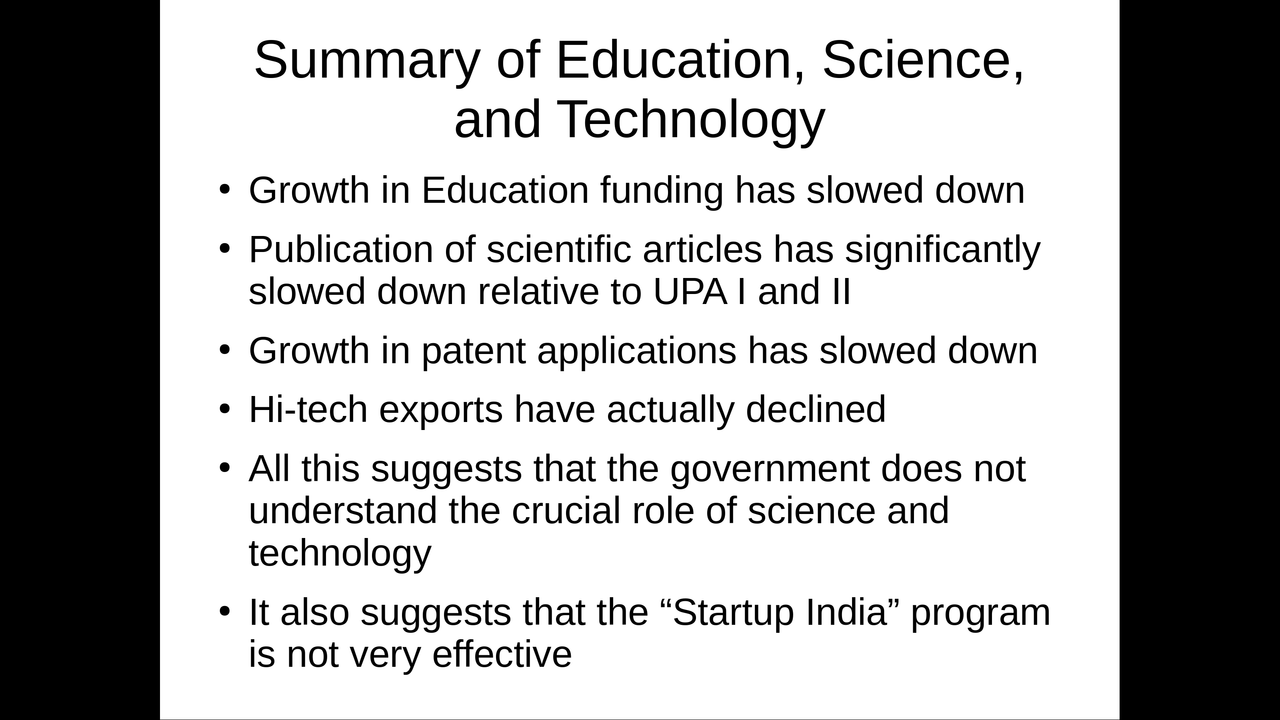
Summary: Education, Science, and Technology
67 / 120
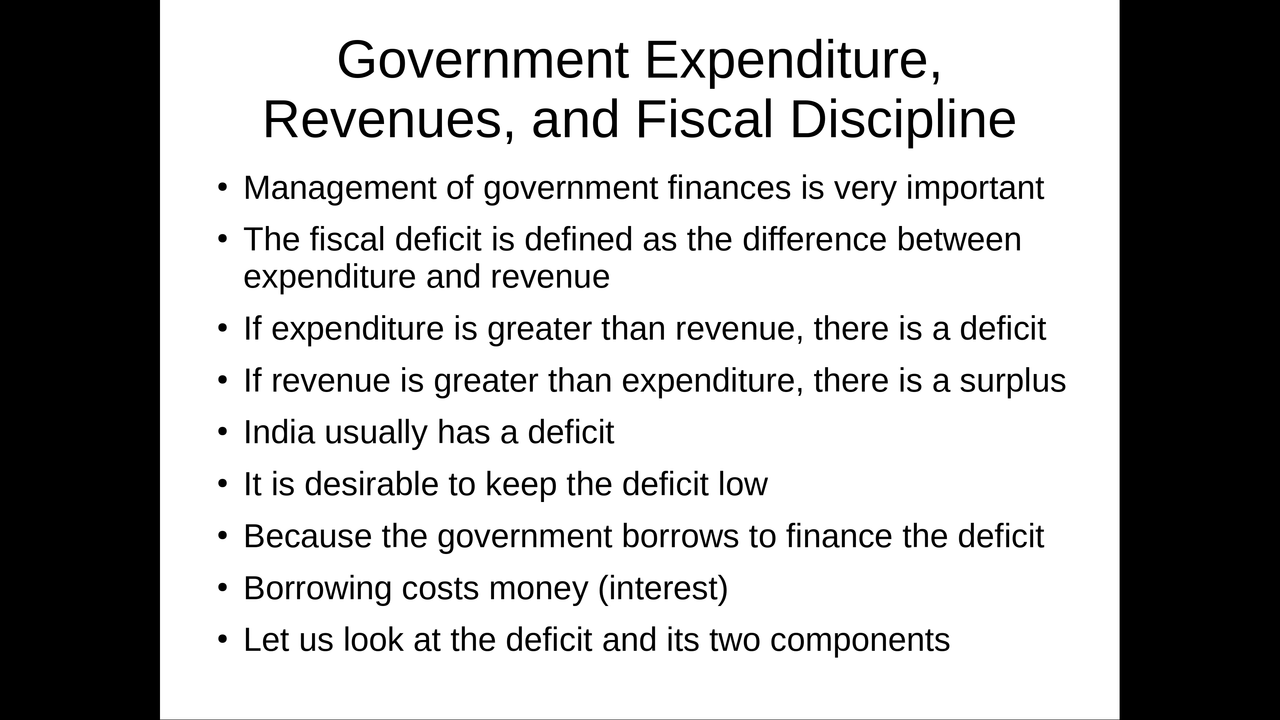
Government Expenditure, Revenues, and Fiscal Discipline
68 / 120
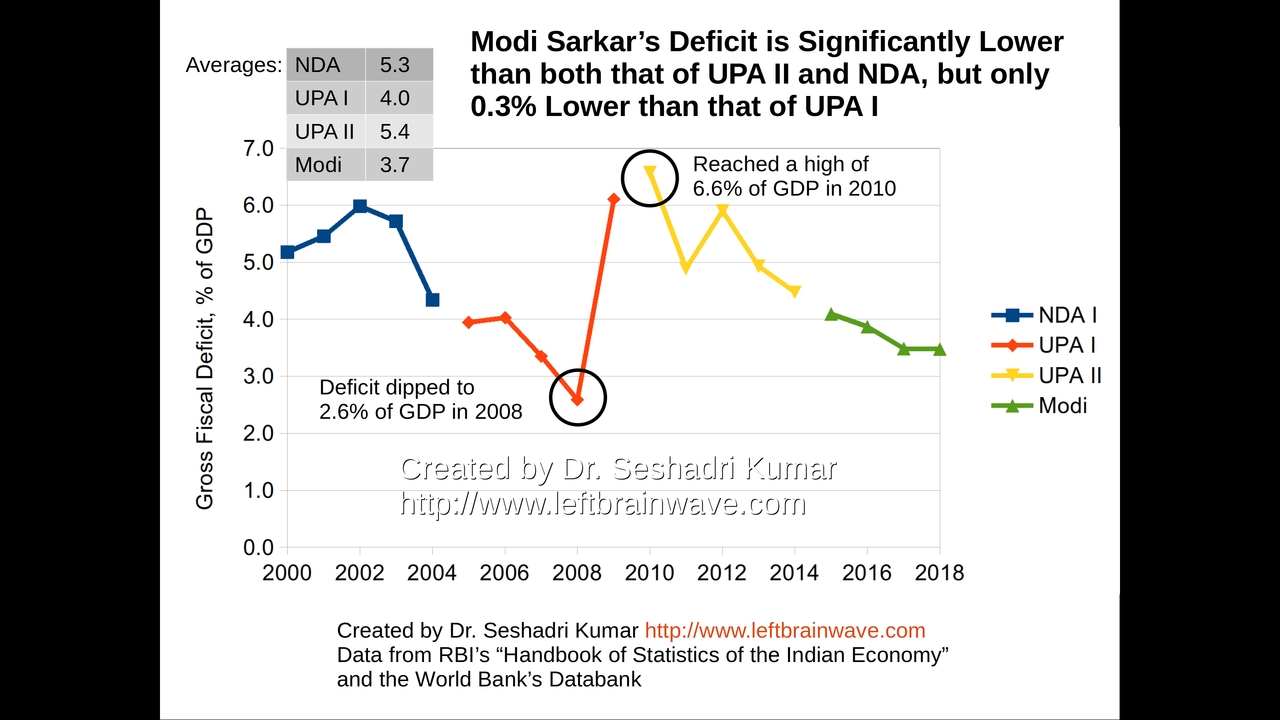
Gross Fiscal Deficit
69 / 120
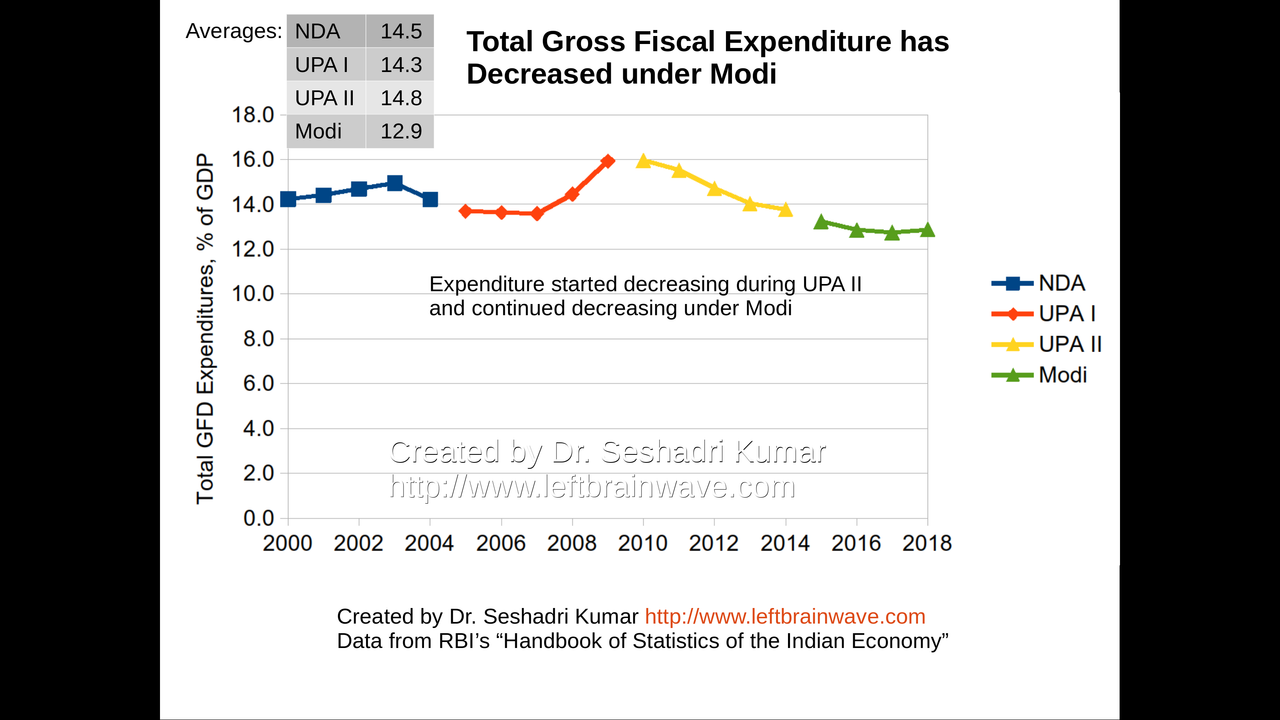
Total Expenditure
70 / 120
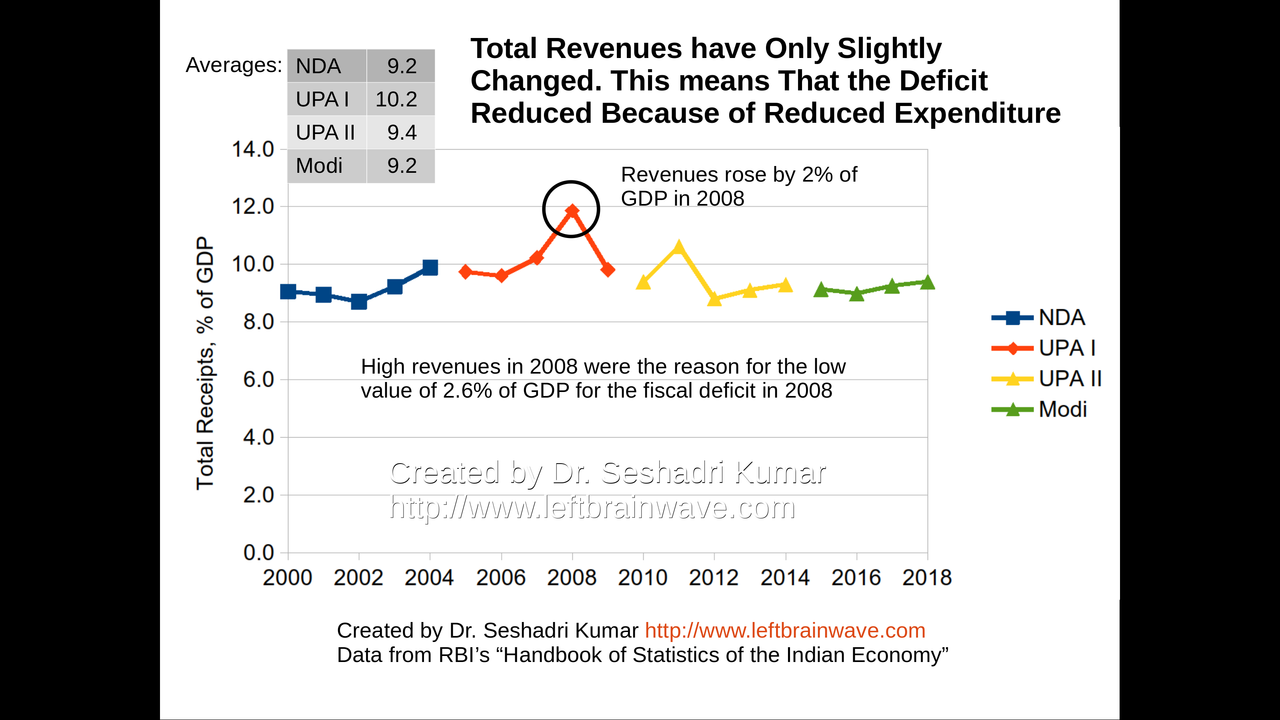
Total Revenues
71 / 120
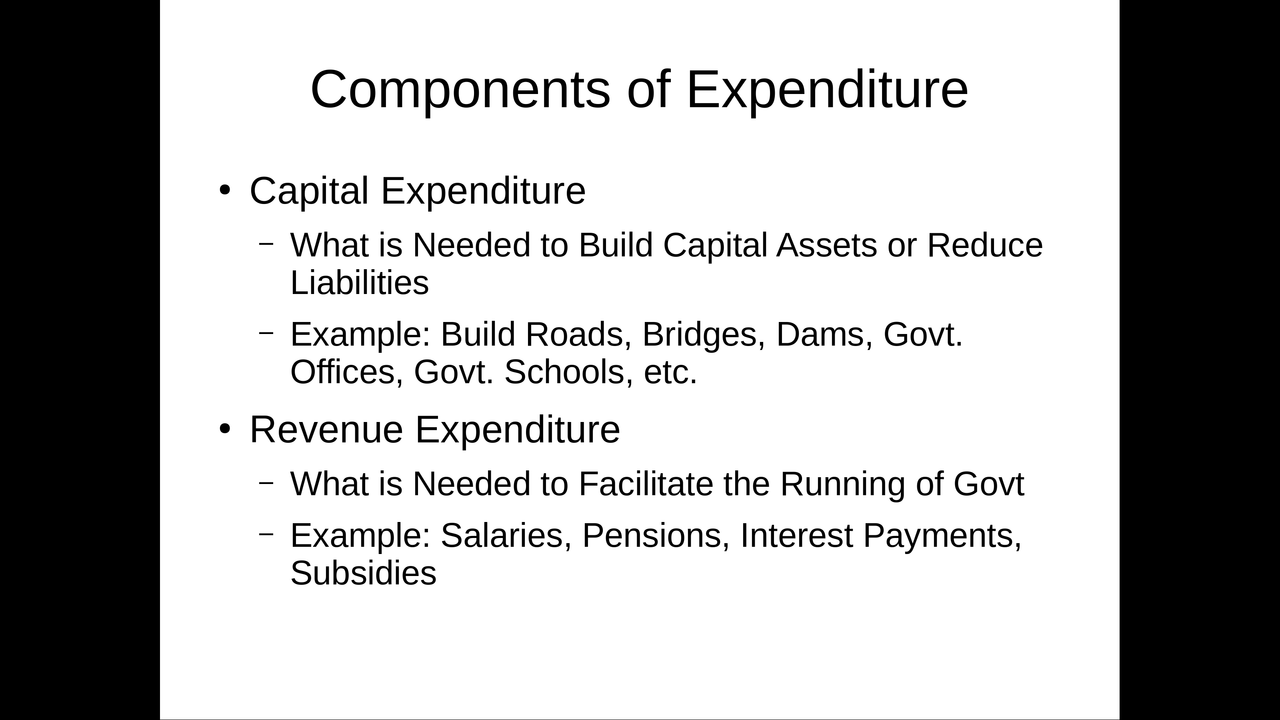
Components of Expenditure
72 / 120
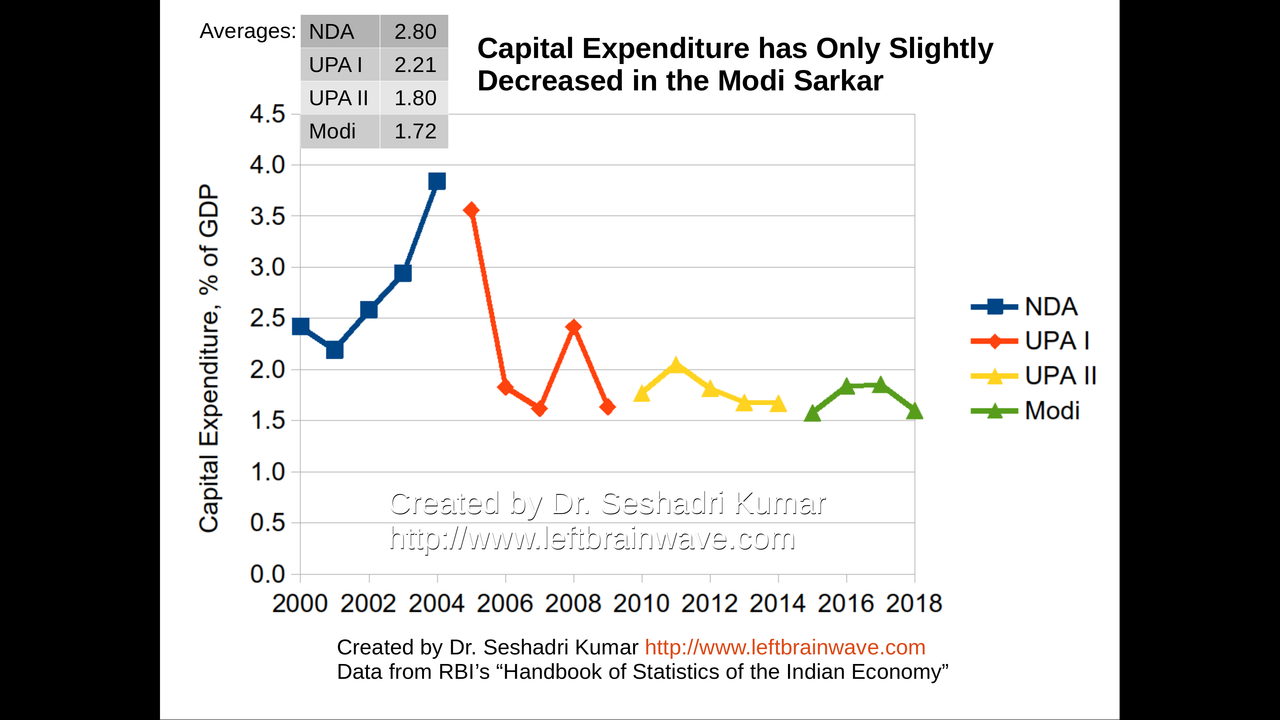
Capital Expenditure
73 / 120
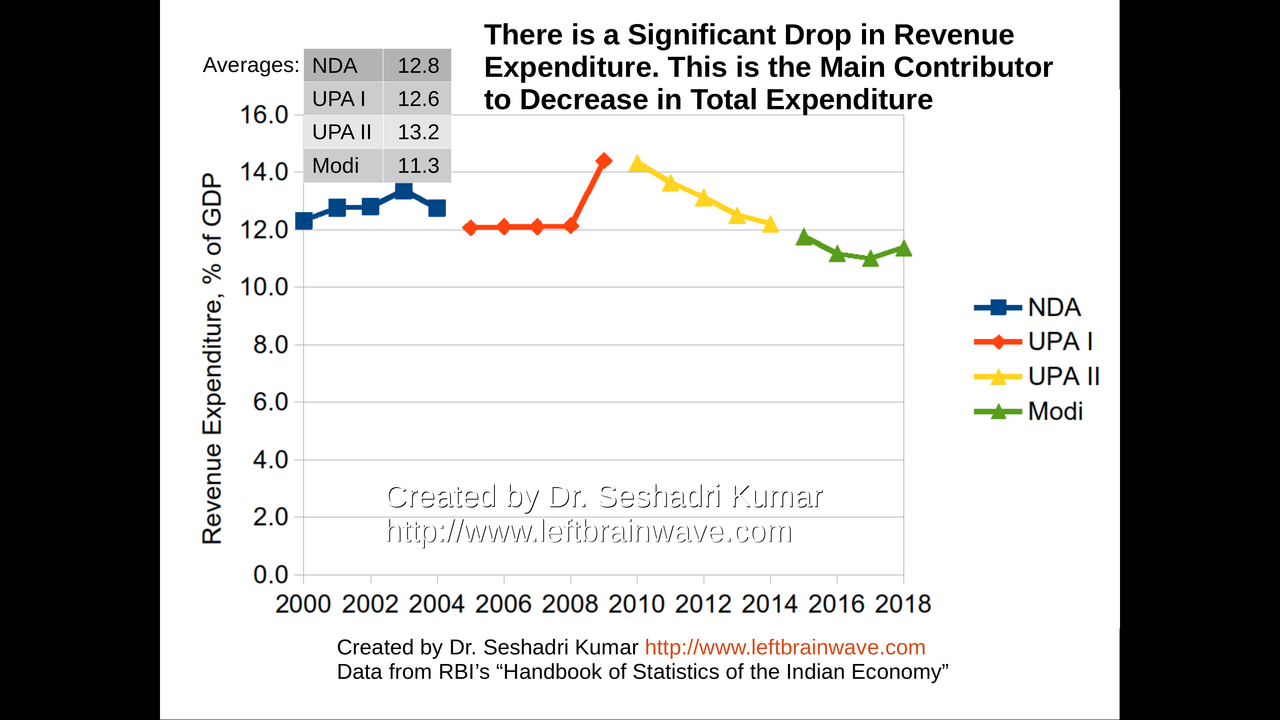
Revenue Expenditure
74 / 120
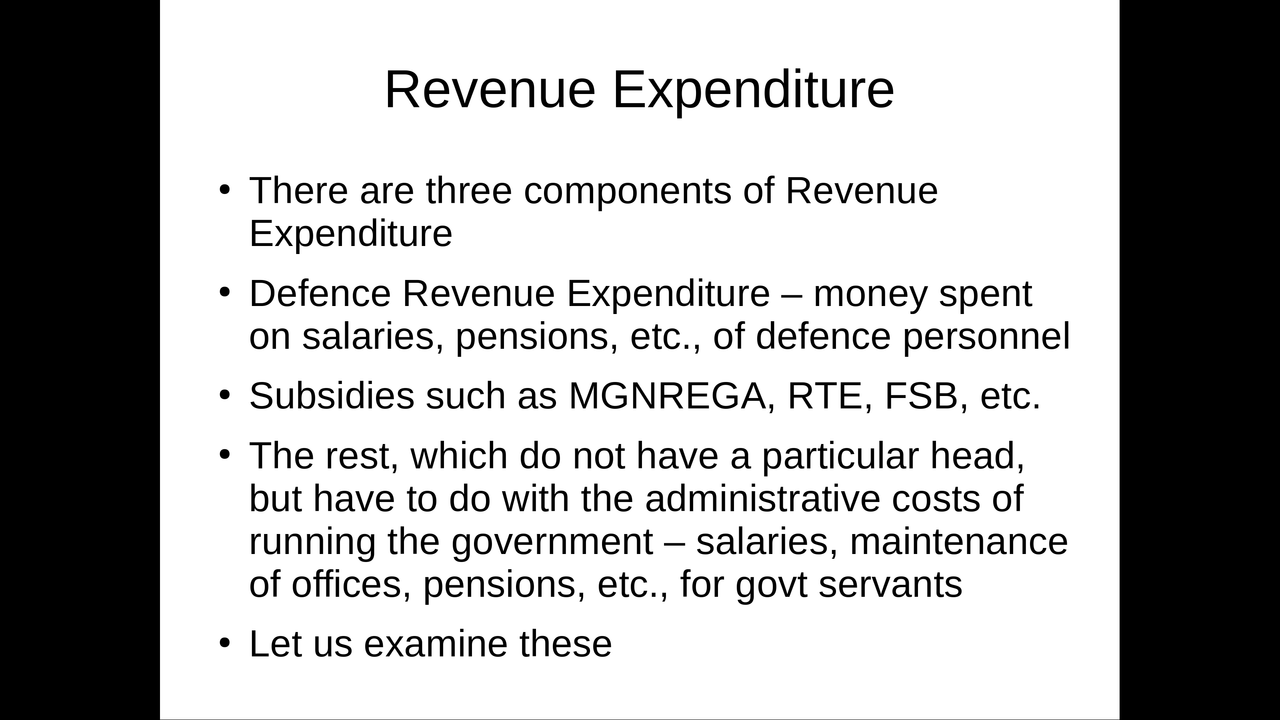
Components of Revenue Expenditure
75 / 120
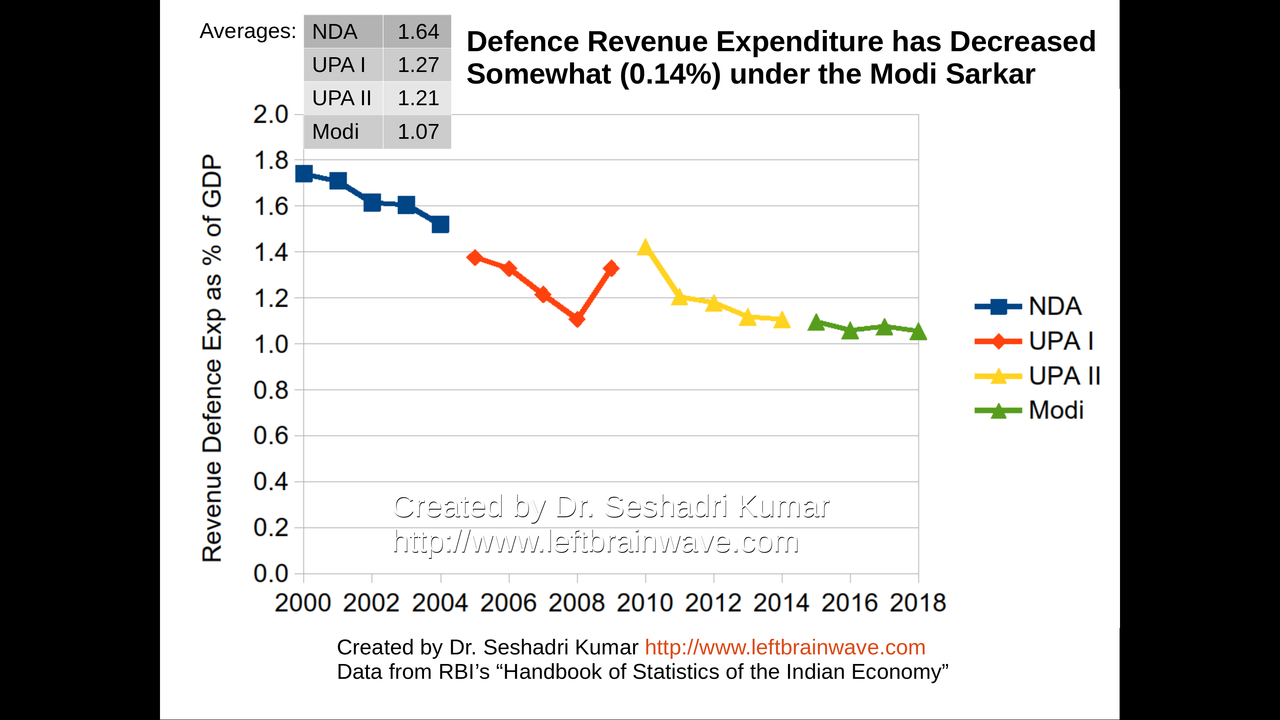
Defence Revenue Expenditure
76 / 120
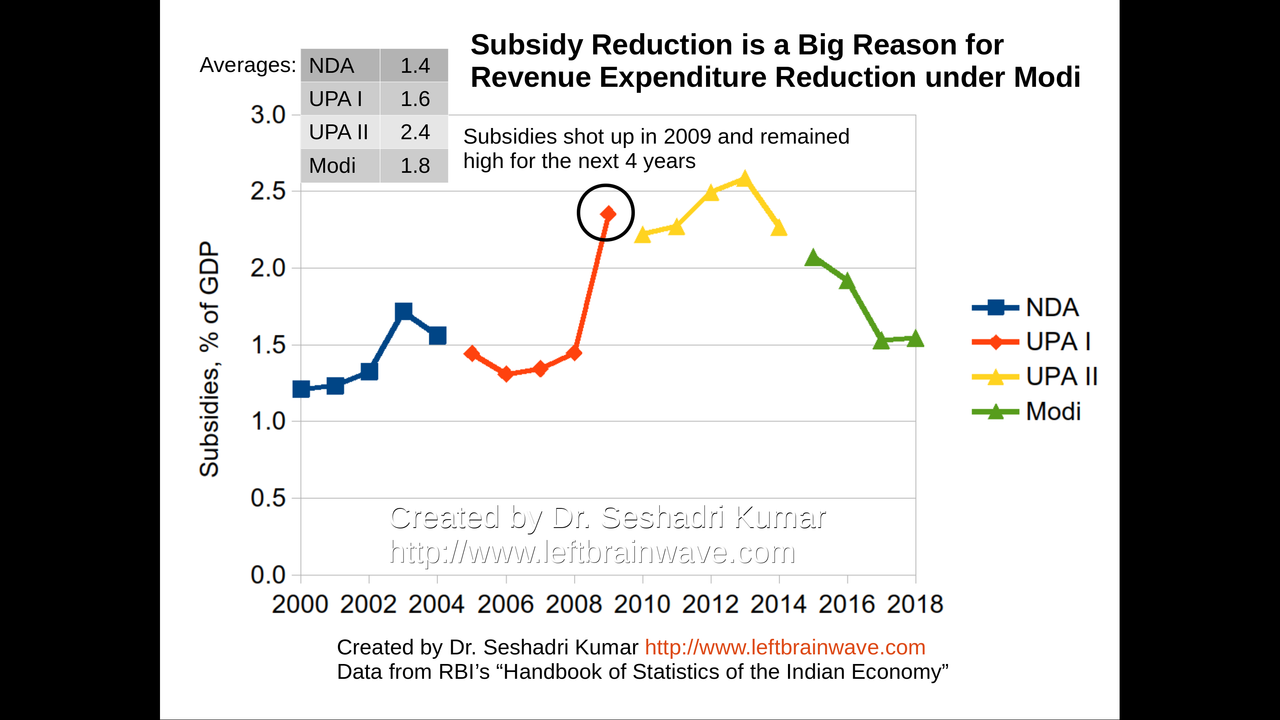
Expenditure on Subsidies
77 / 120
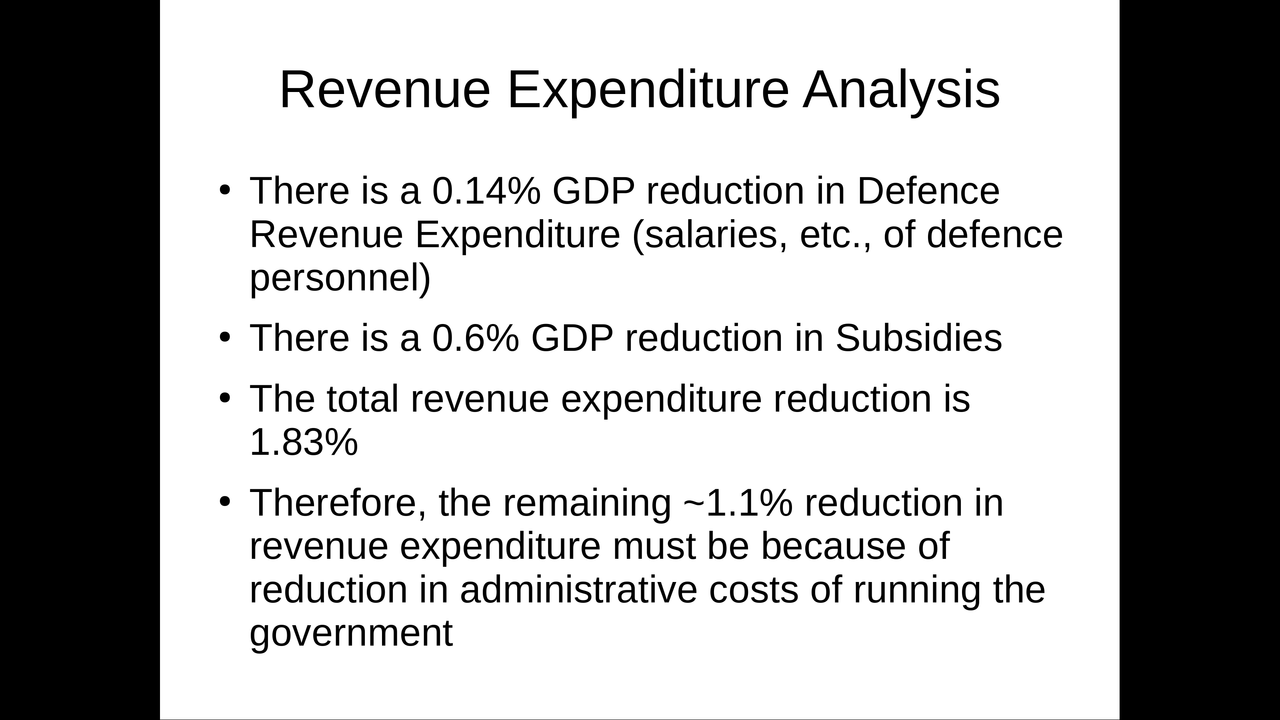
Revenue Expenditure Analysis
78 / 120
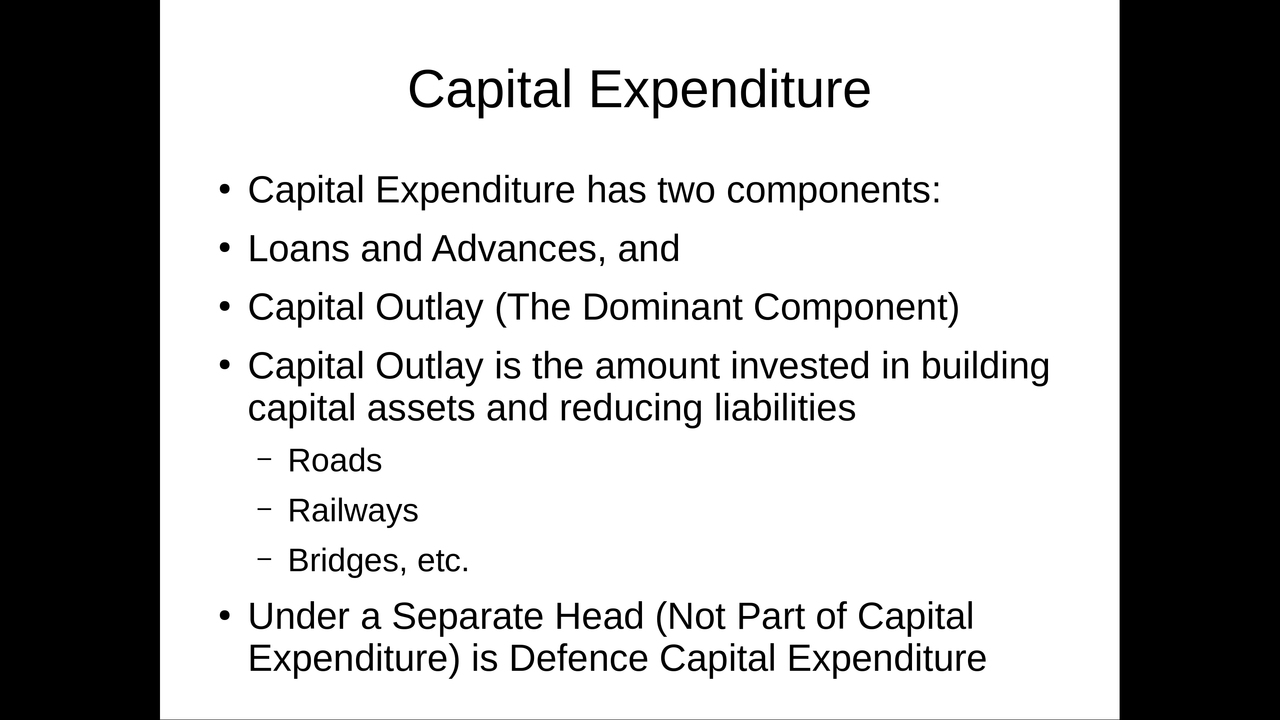
Capital Expenditure
79 / 120
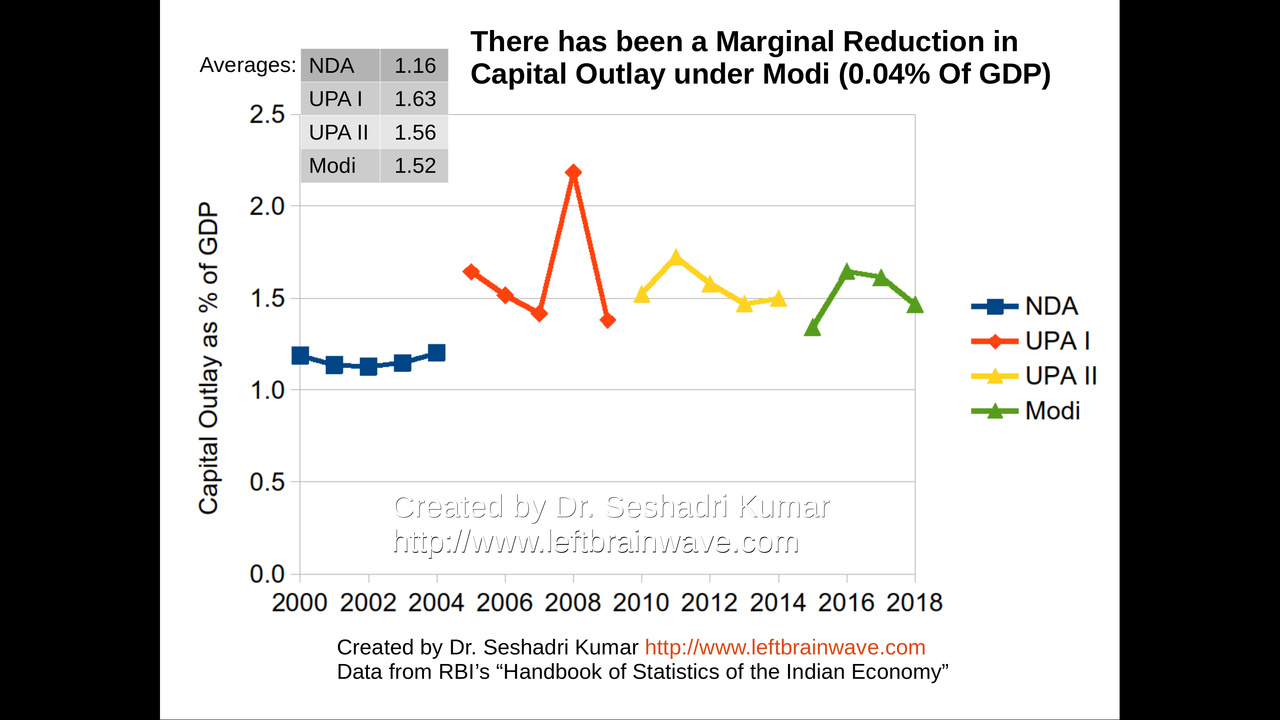
Capital Outlay
80 / 120
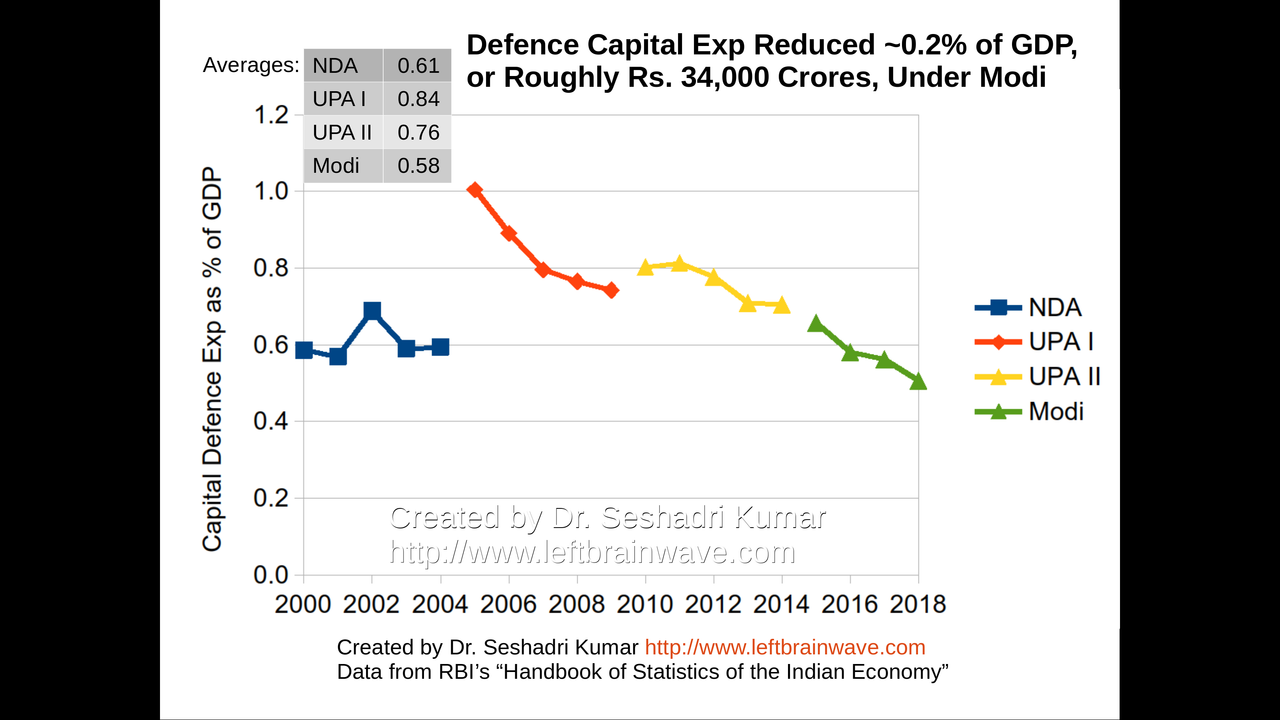
Defence Capital Expenditure
81 / 120
Components of Revenue
82 / 120
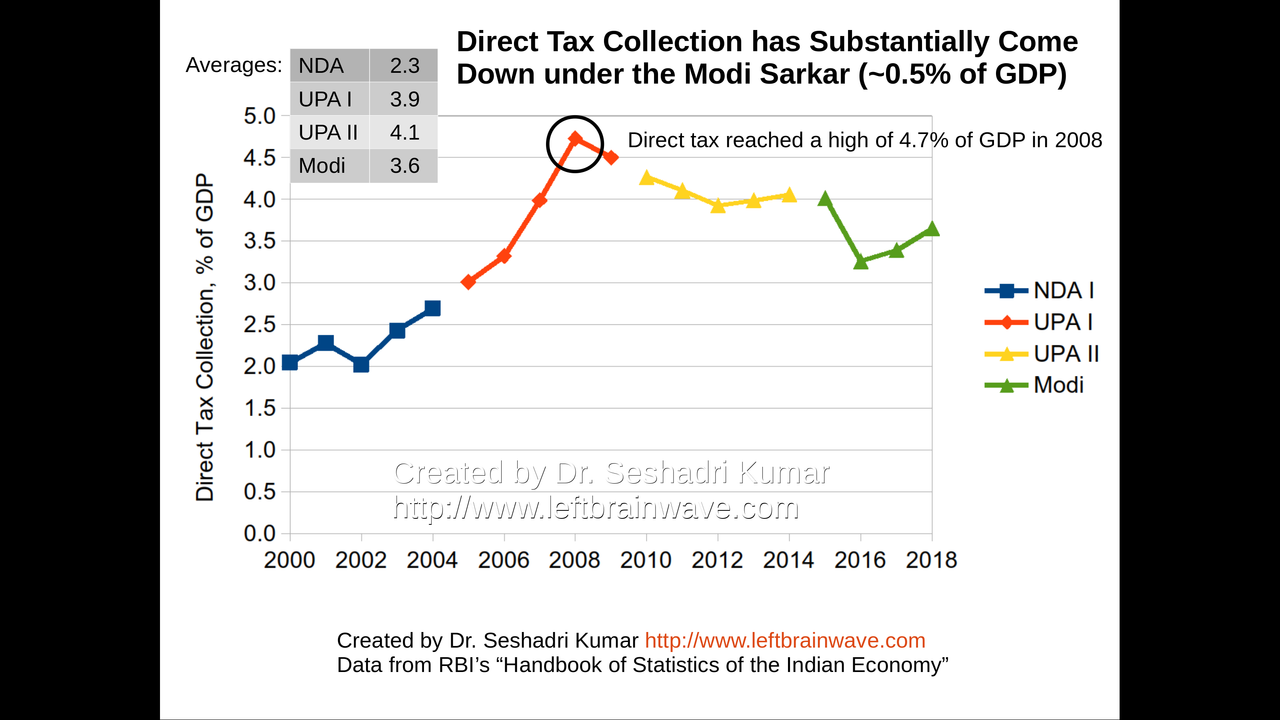
Direct Tax Collection
83 / 120

Personal Income Tax Collection
84 / 120
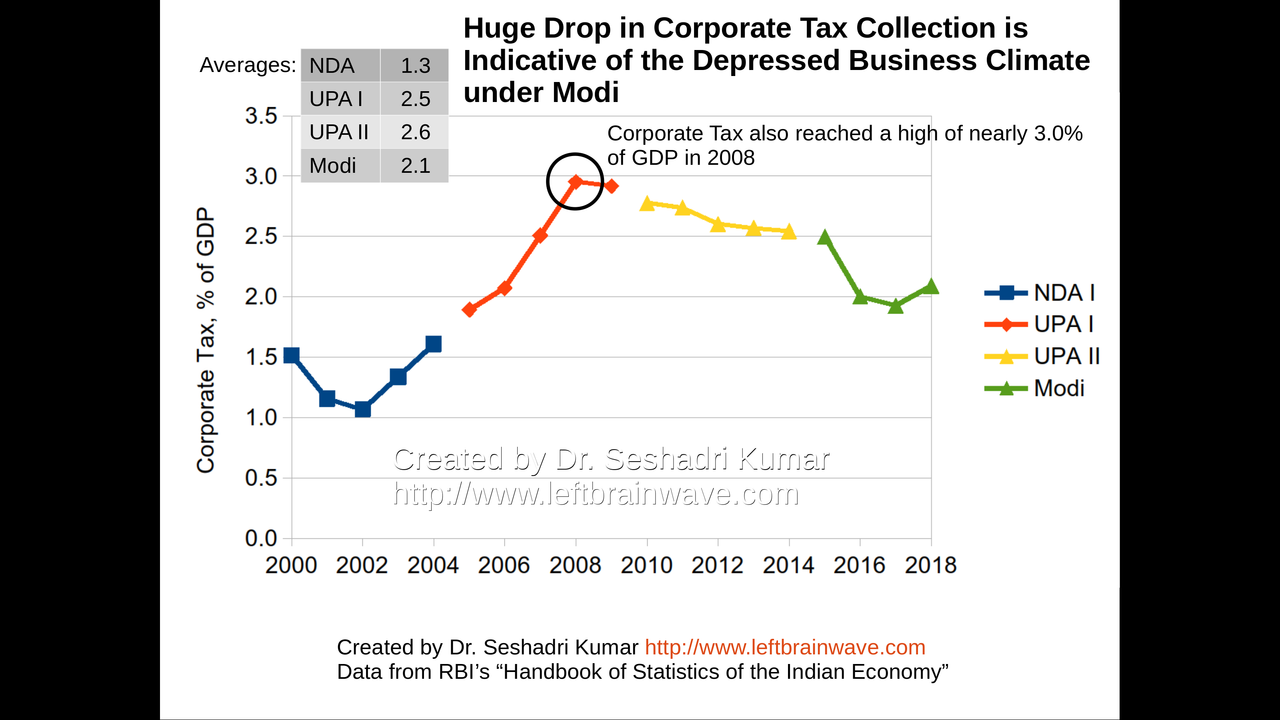
Corporate Tax Collection
85 / 120
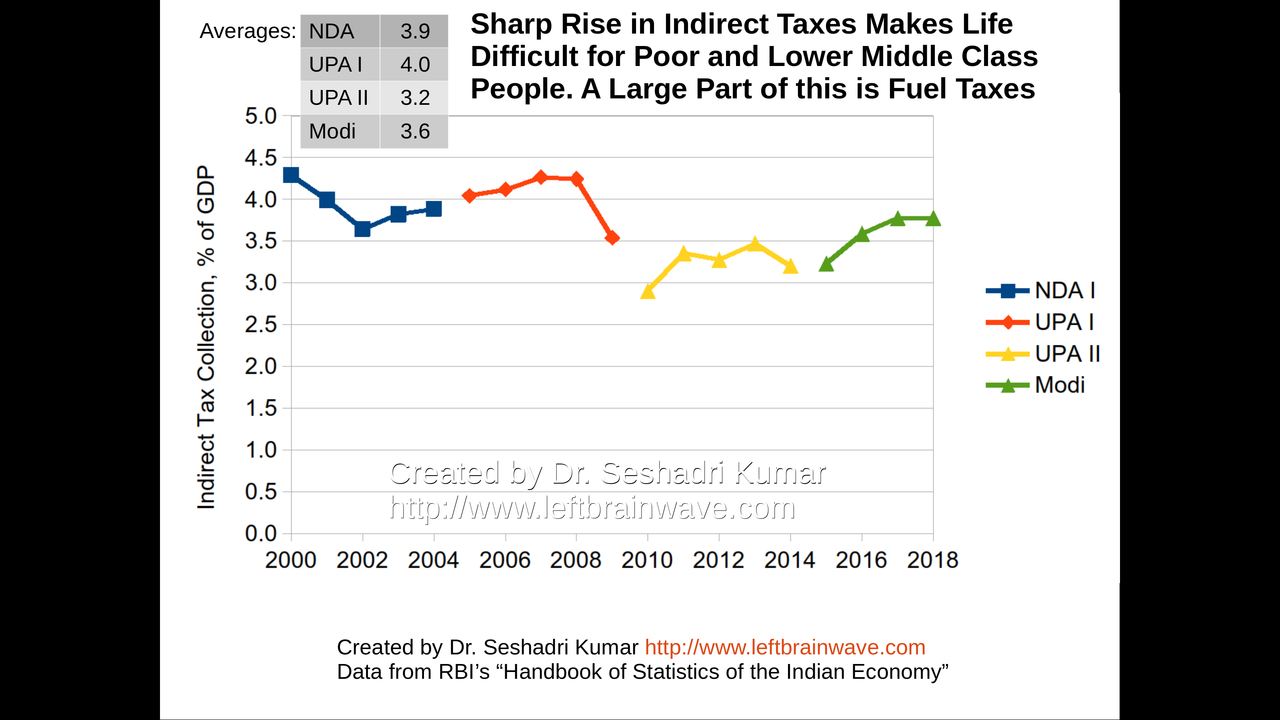
Indirect Tax Collection
86 / 120
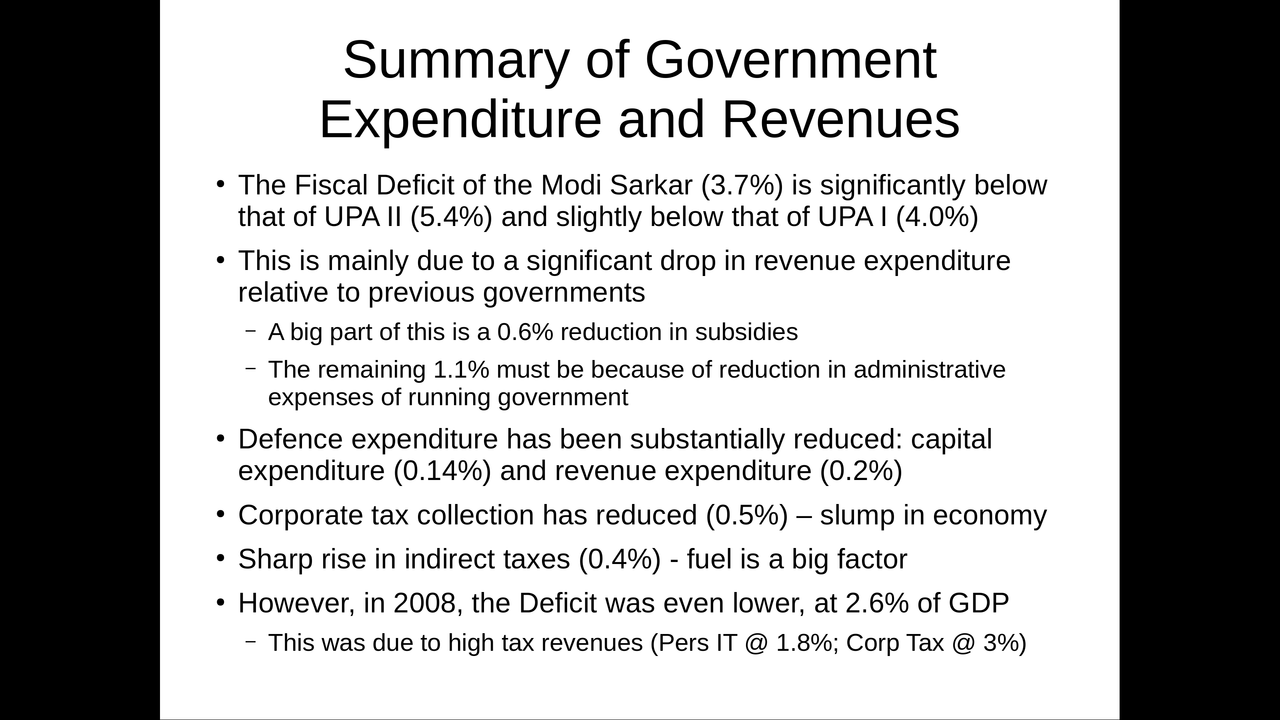
Summary: Government Expenditures and Revenues
87 / 120
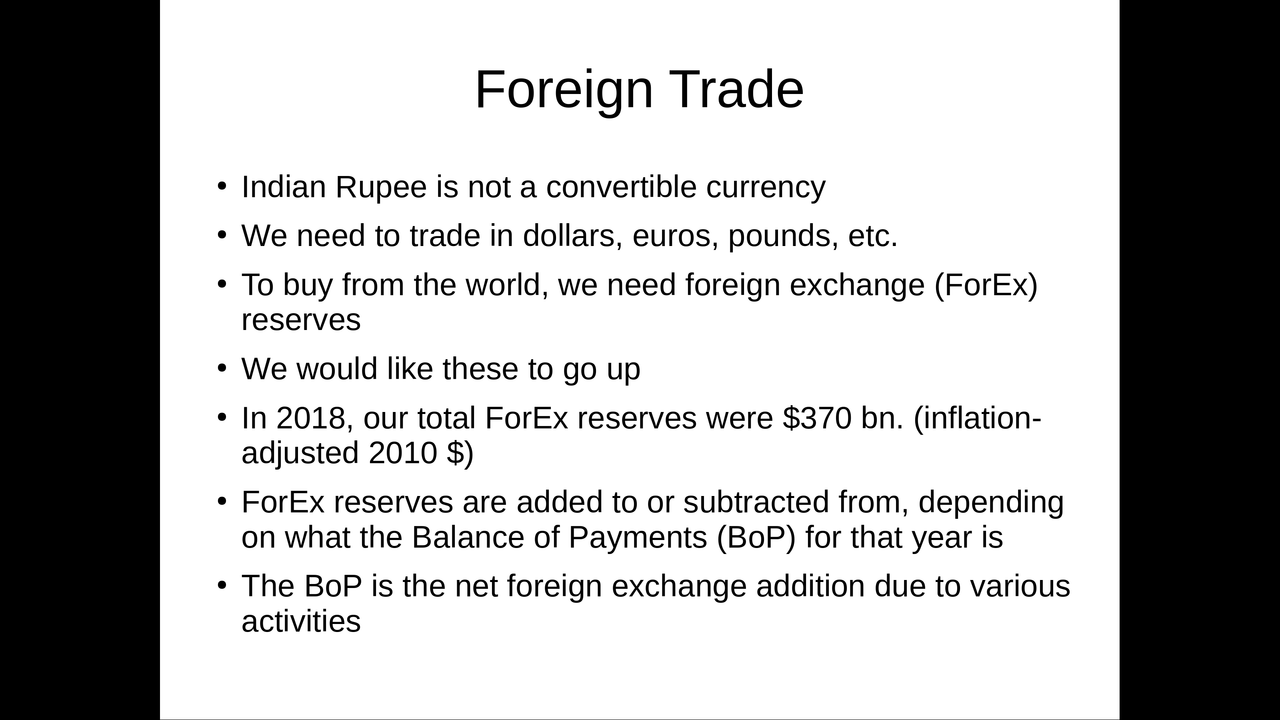
Foreign Trade
88 / 120
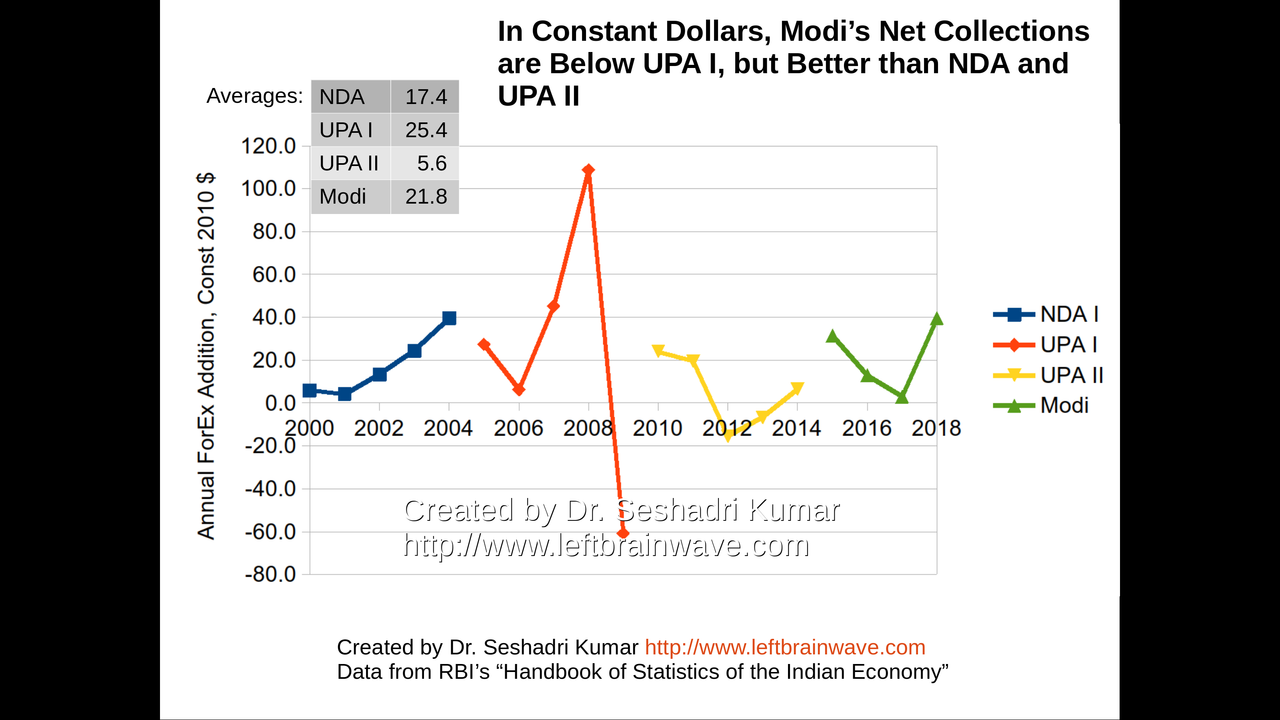
Annual Foreign Exchange Addition
89 / 120
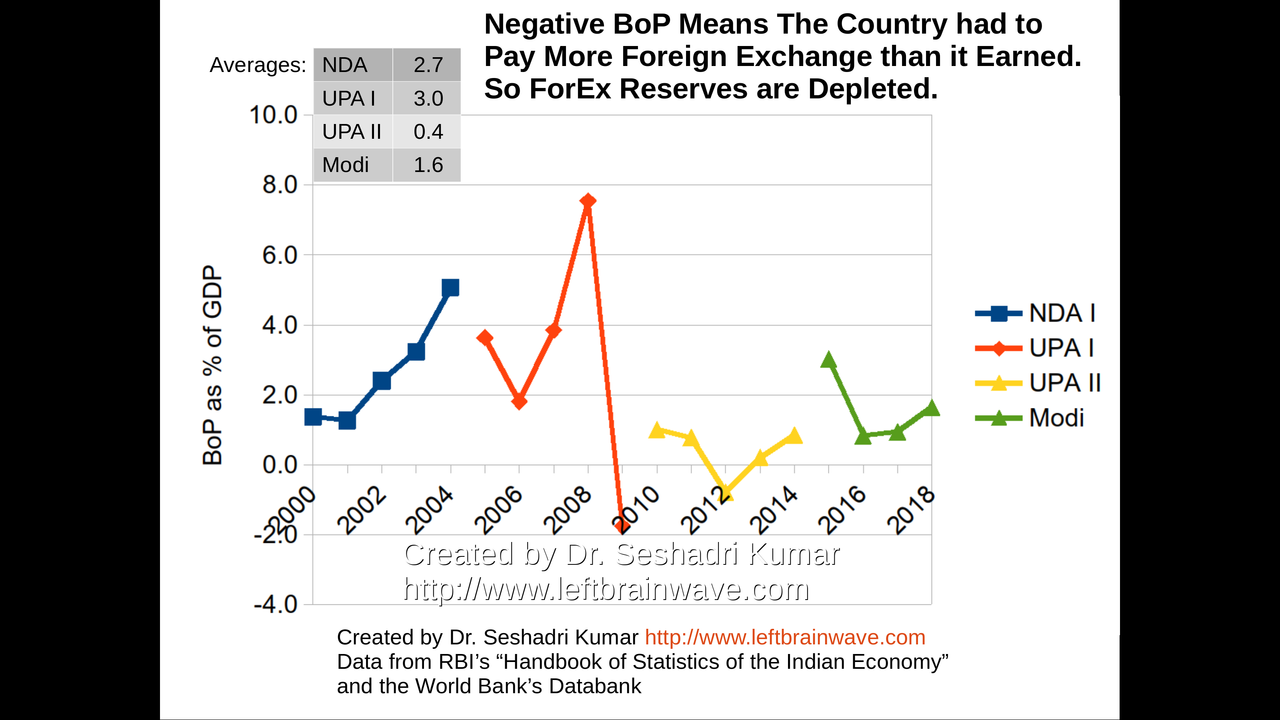
Balance of Payments
90 / 120

Constituents of Balance of Payments
91 / 120
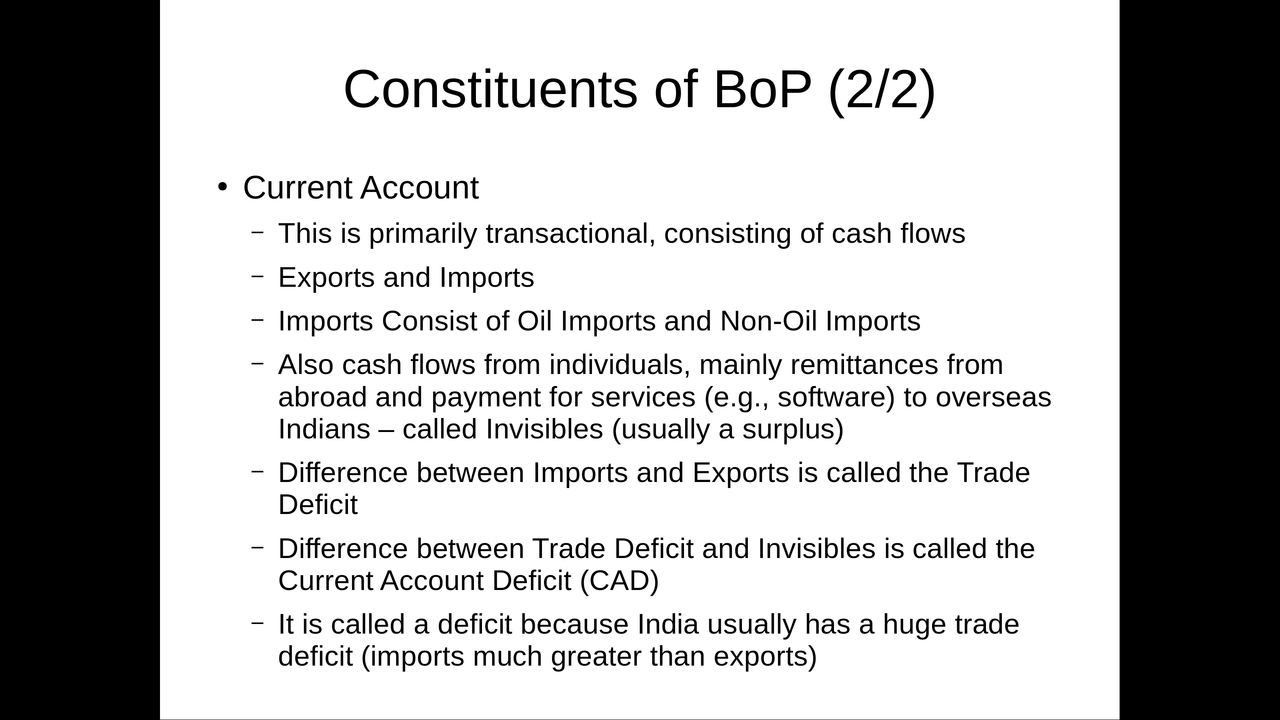
Constituents of Balance of Payments
92 / 120
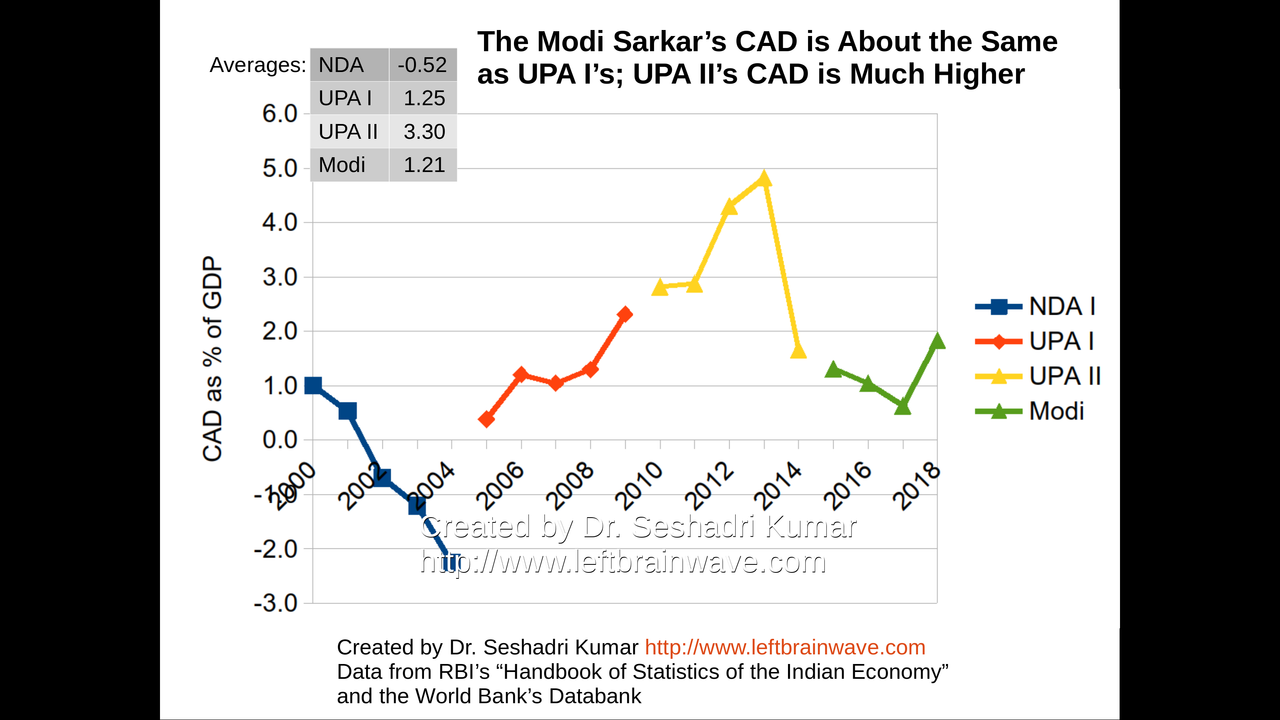
Current Account Deficit
93 / 120
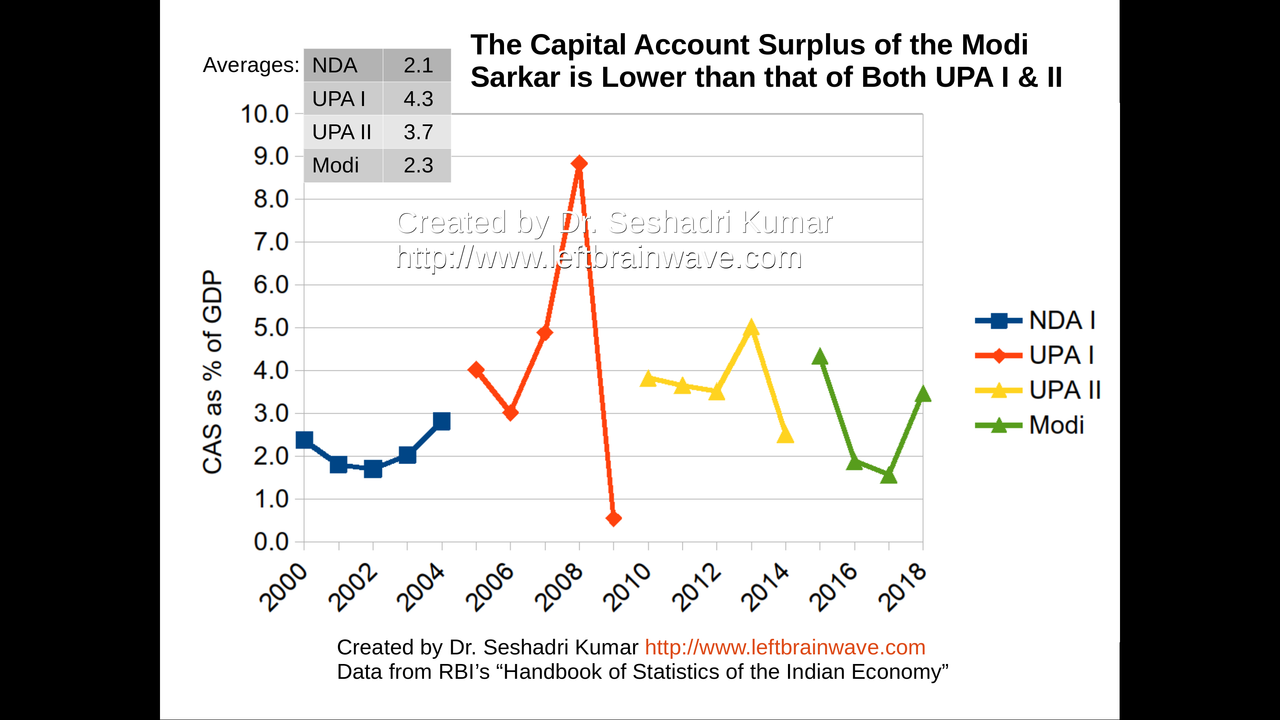
Capital Account Surplus
94 / 120
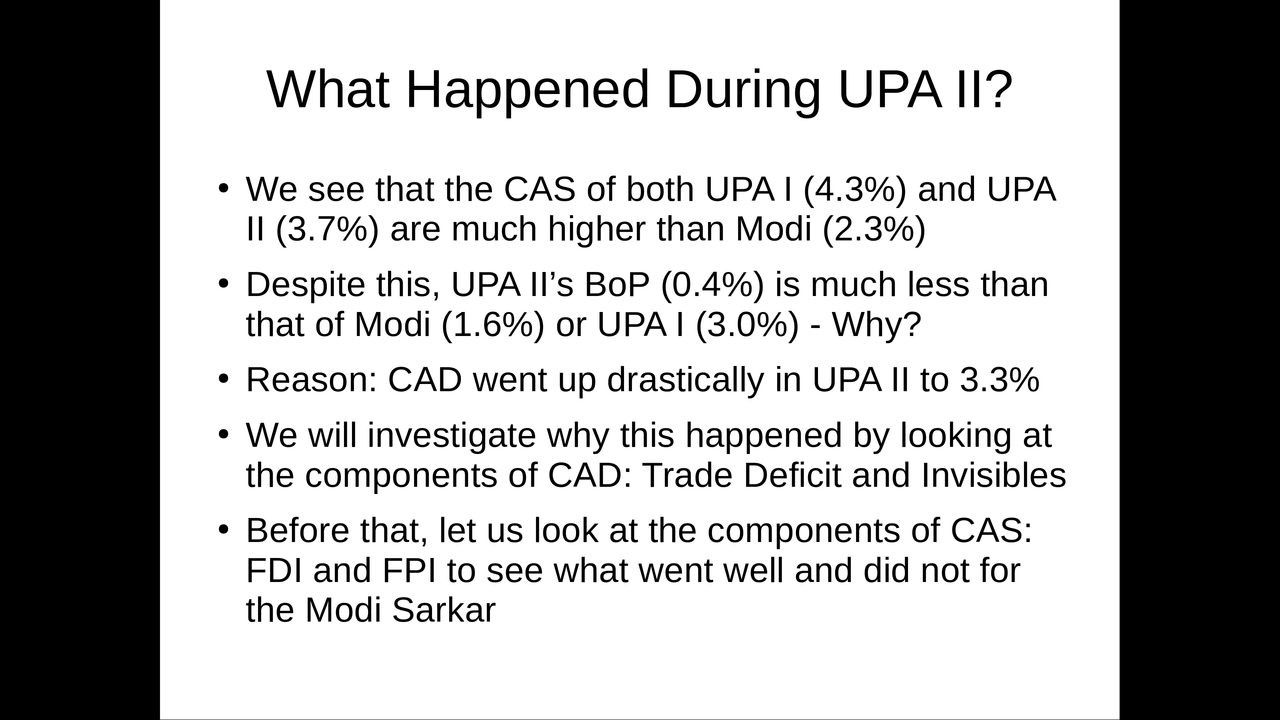
What Happened During UPA II?
95 / 120
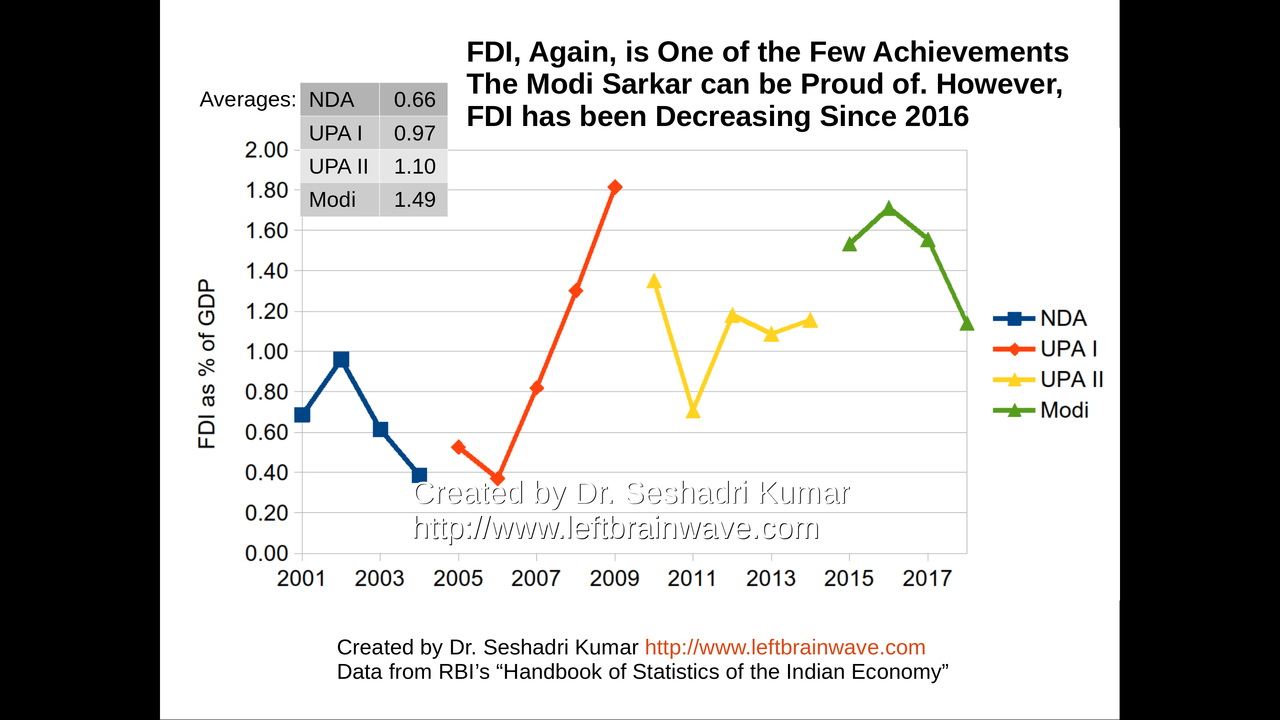
Foreign Direct Investment
96 / 120
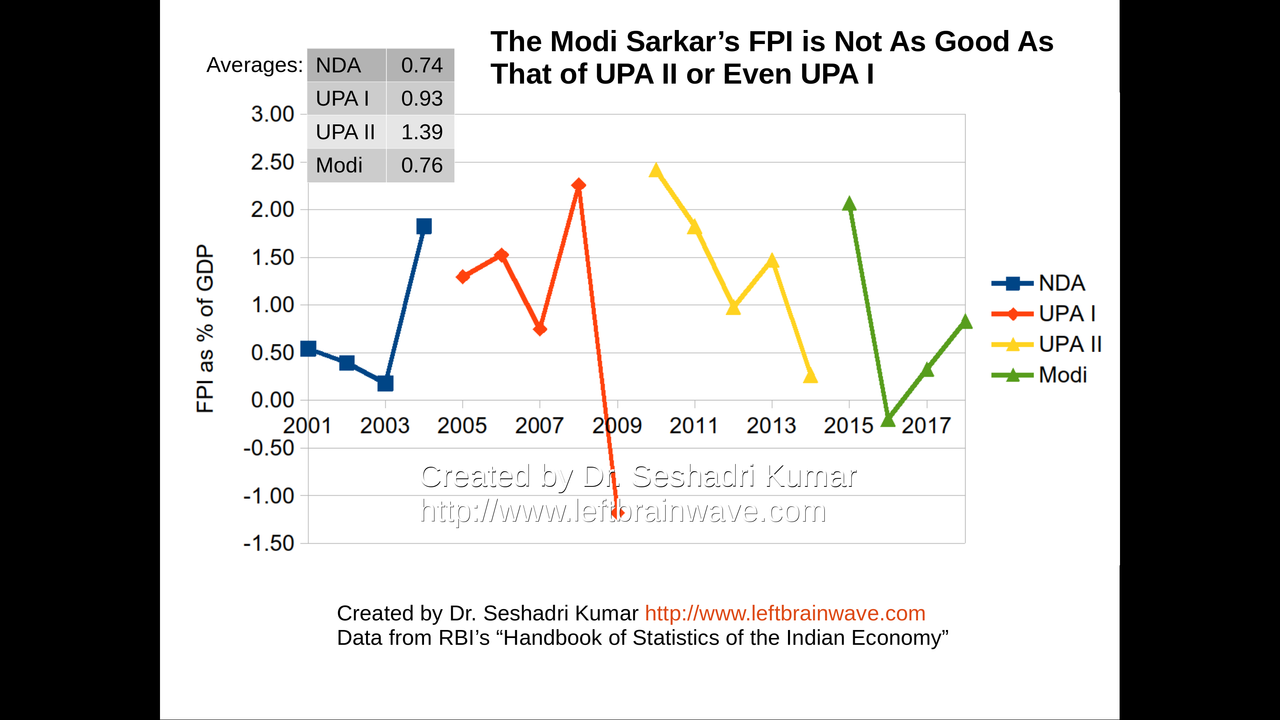
Foreign Portfolio Investment
97 / 120
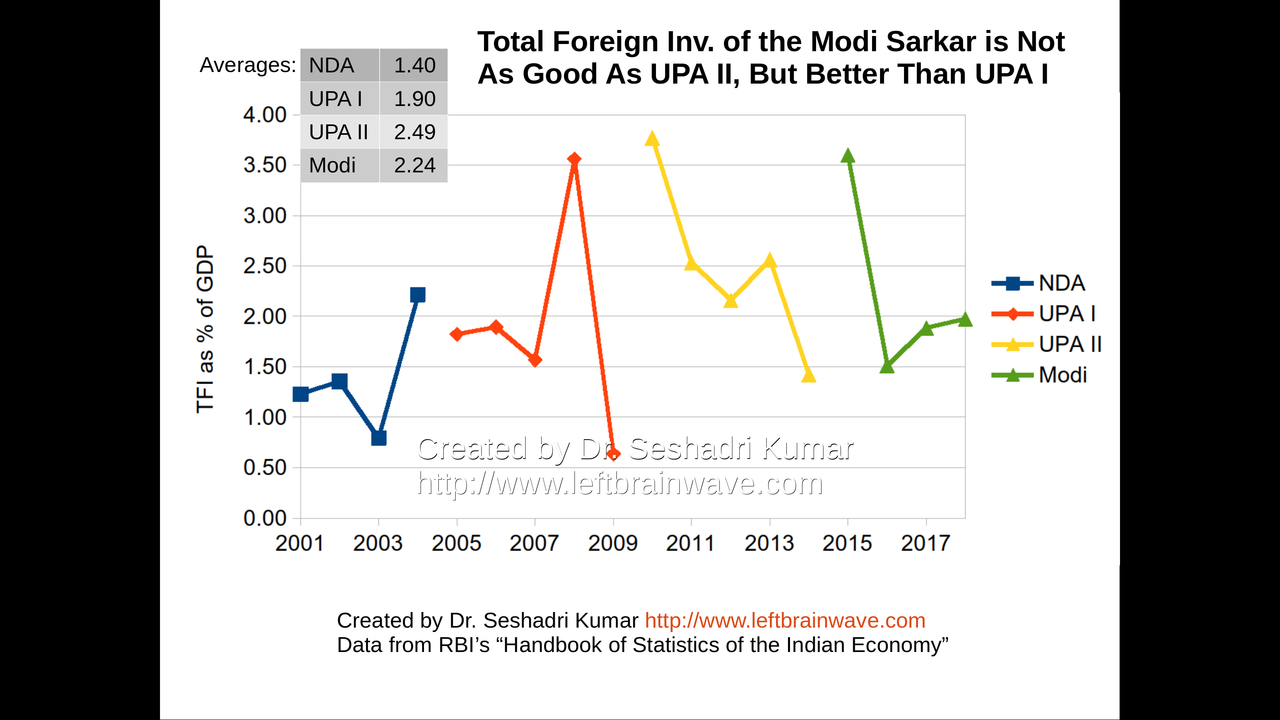
Total Foreign Investment
98 / 120
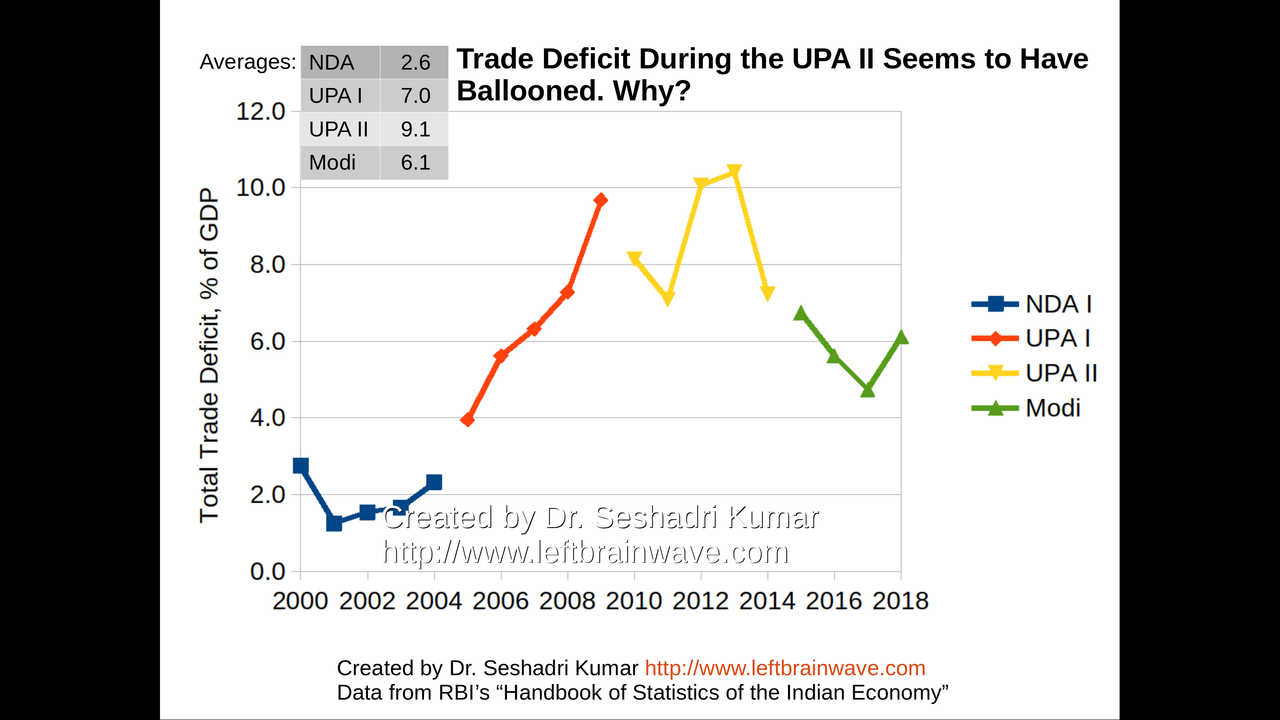
Trade Deficit
99 / 120

Invisibles
100 / 120
Why is the Trade Deficit Lower for the Modi Sarkar?
101 / 120
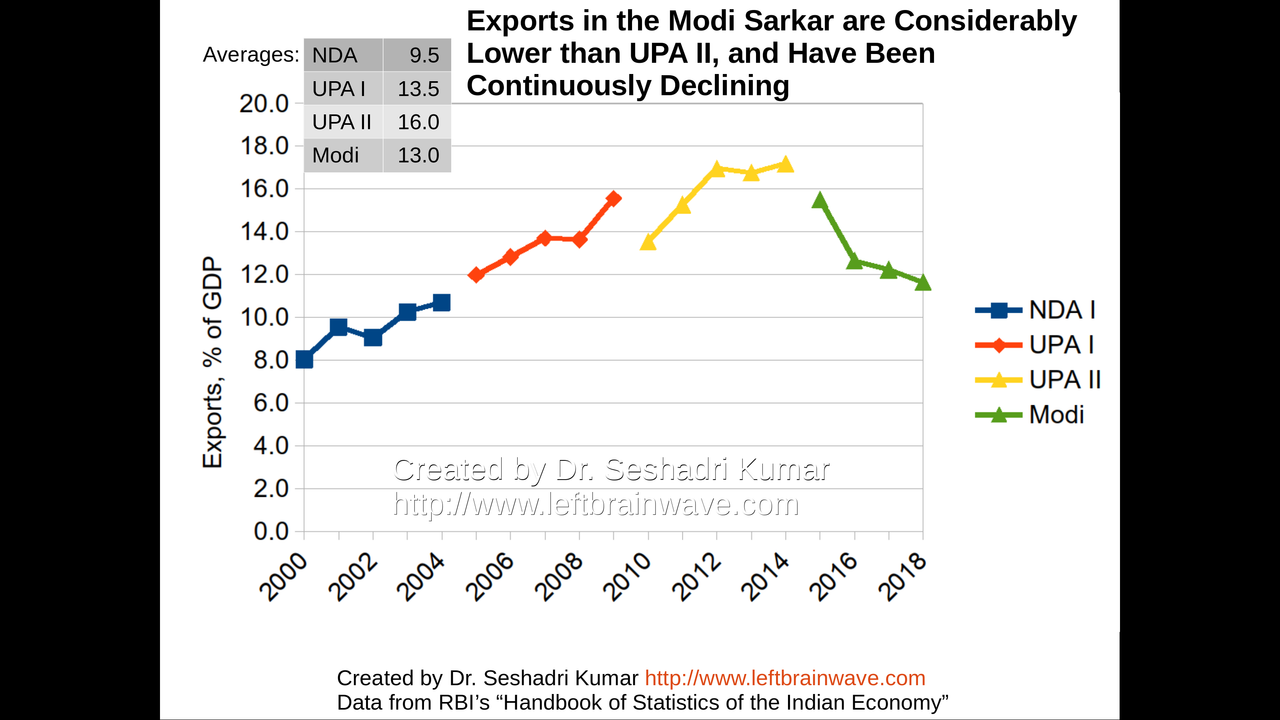
Exports
102 / 120
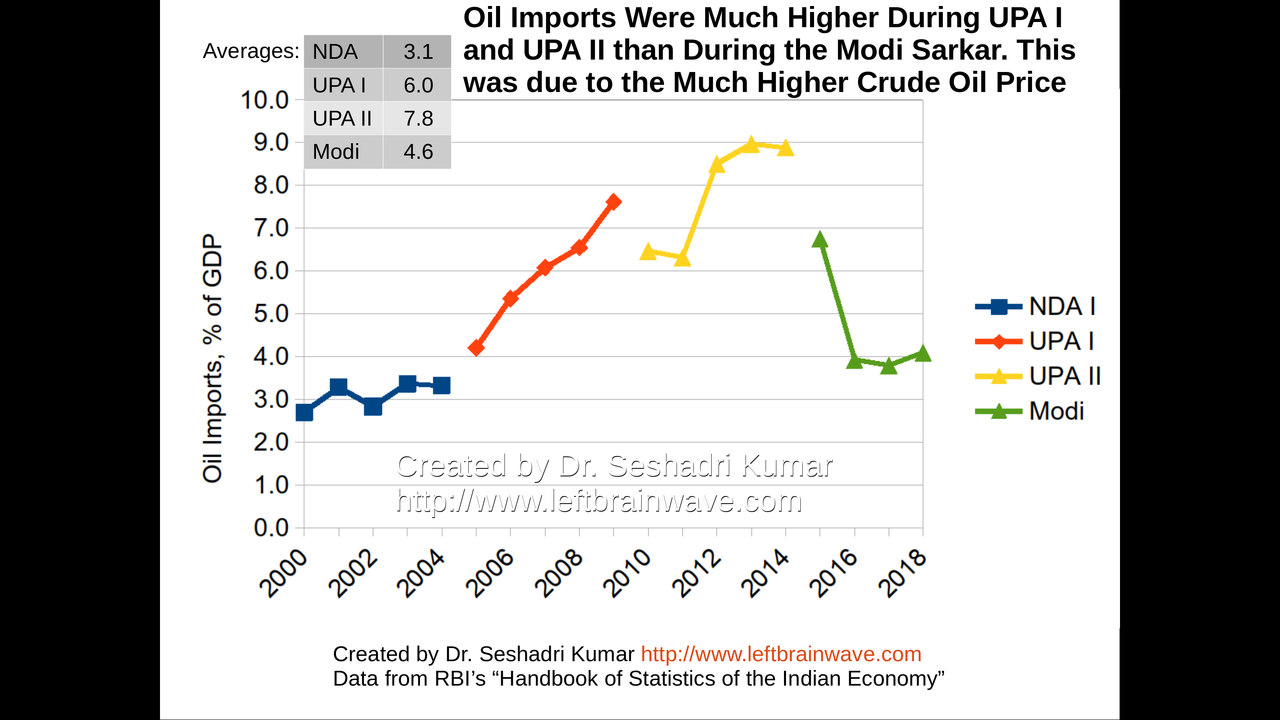
Oil Imports
103 / 120
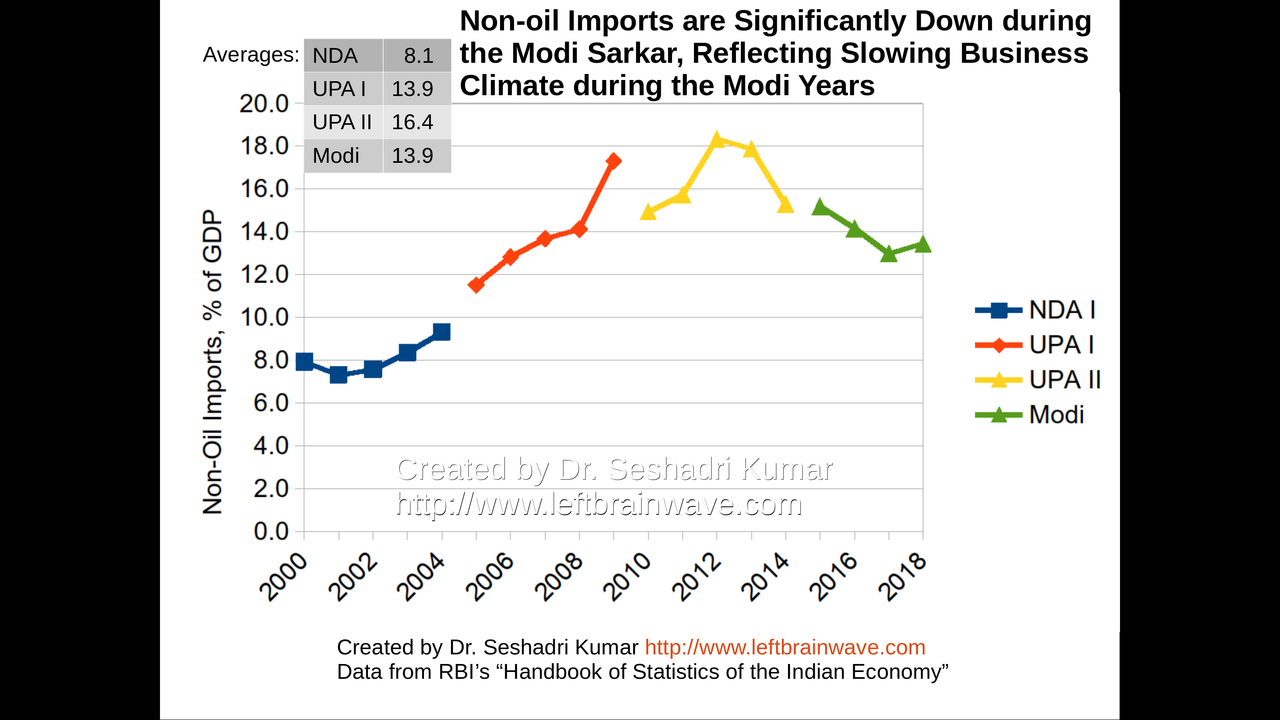
Non-Oil Imports
104 / 120
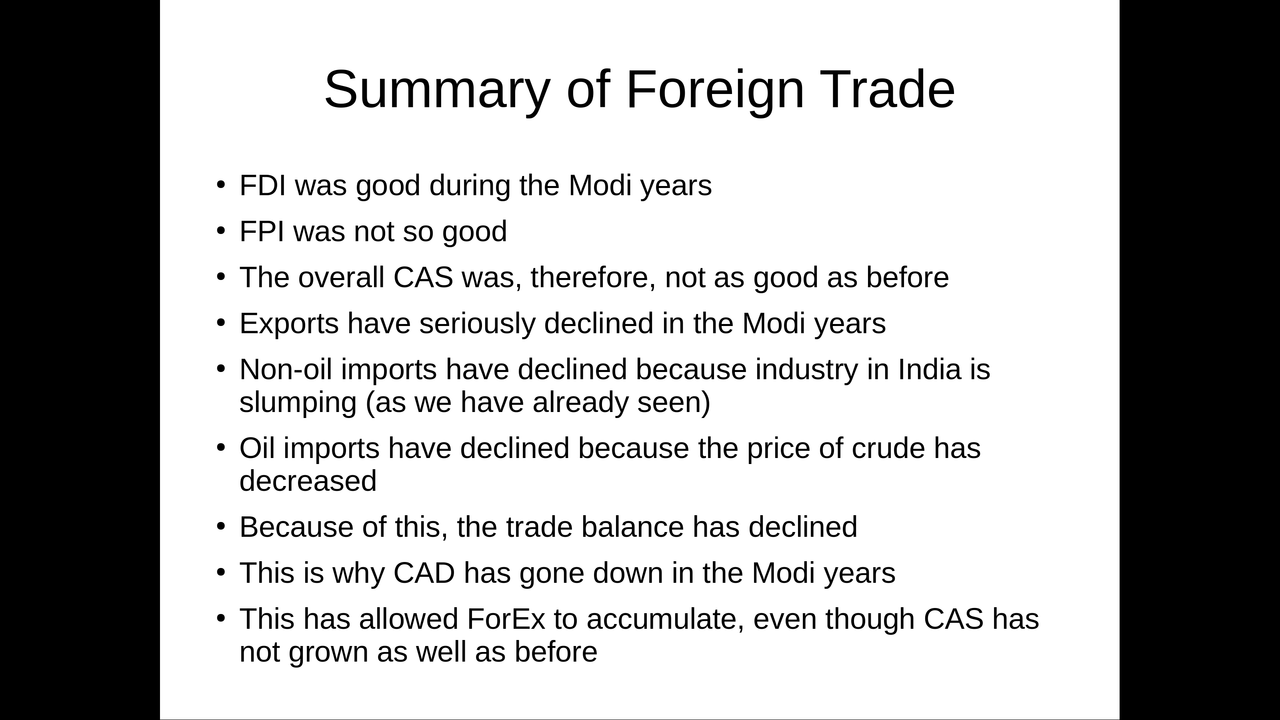
Summary of Foreign Trade
105 / 120
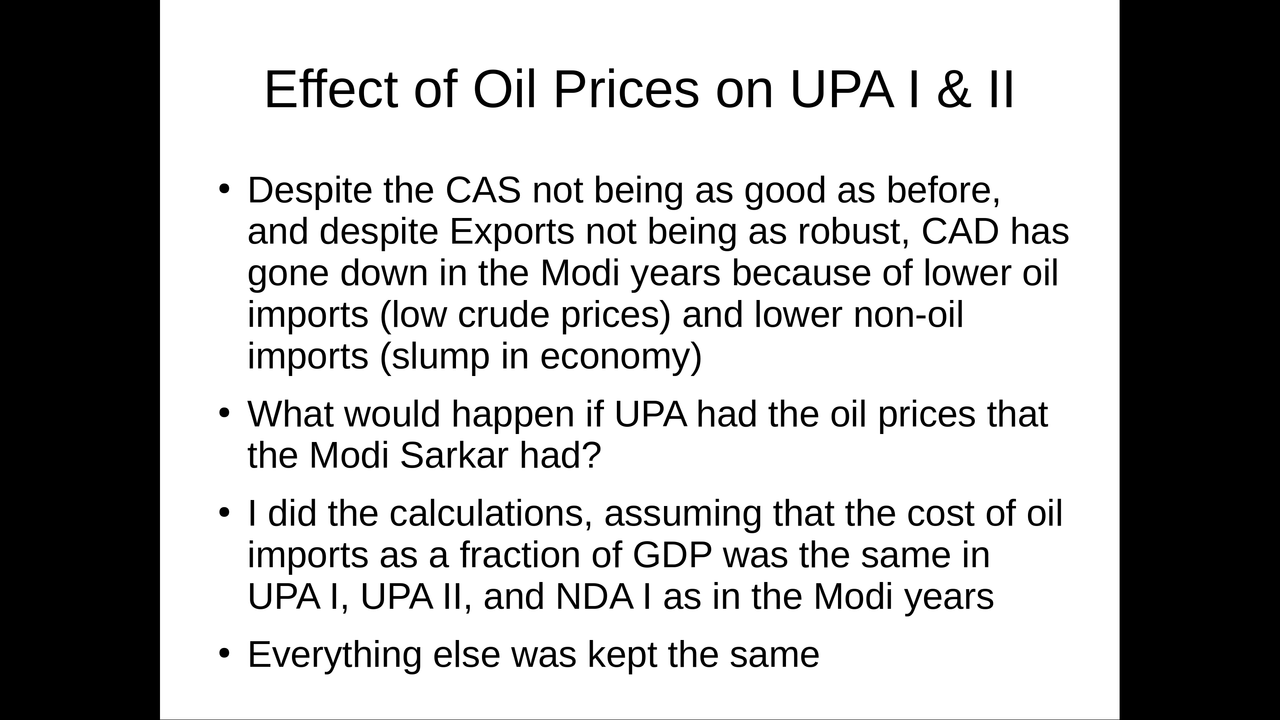
Effect of Oil Prices on UPA I and UPA II
106 / 120

CAD with Oil Import Costs as in Modi Sarkar
107 / 120
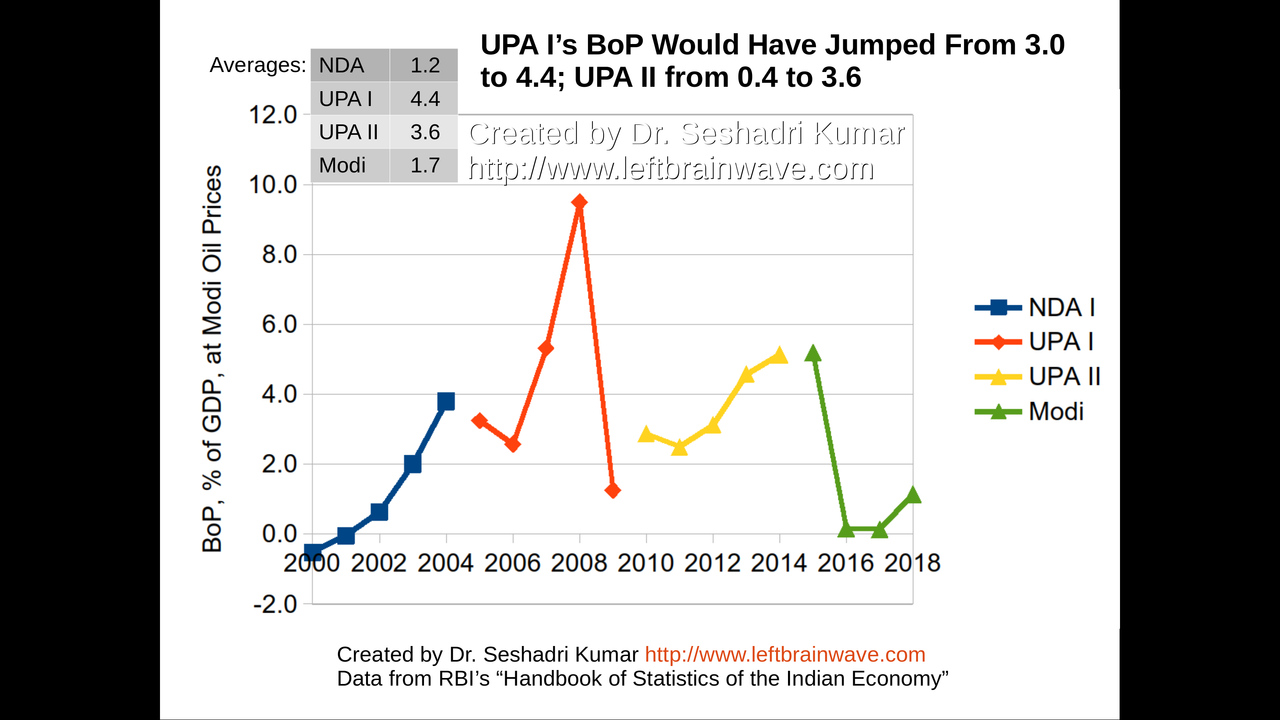
BoP with Oil Import Costs as in Modi Sarkar
108 / 120
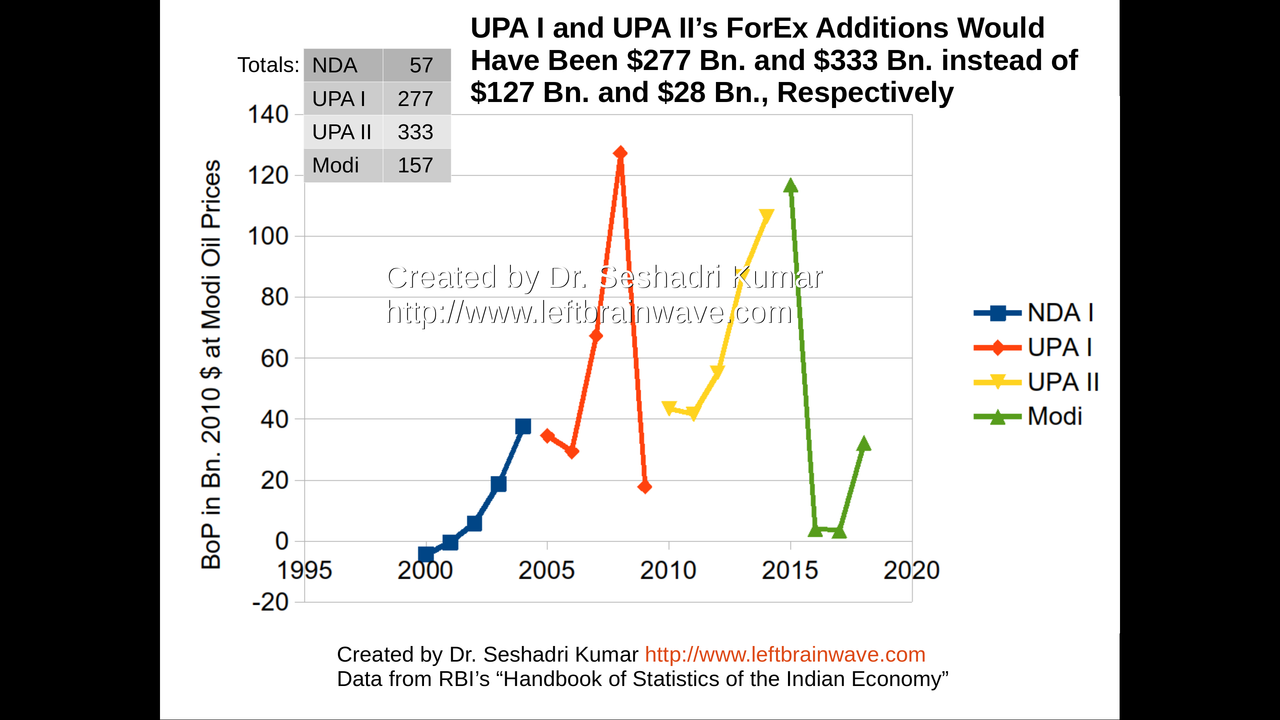
Foreign Exchange Additions at Modi Sarkar Oil Prices
109 / 120
Inflation and Unemployment (1/3)
110 / 120
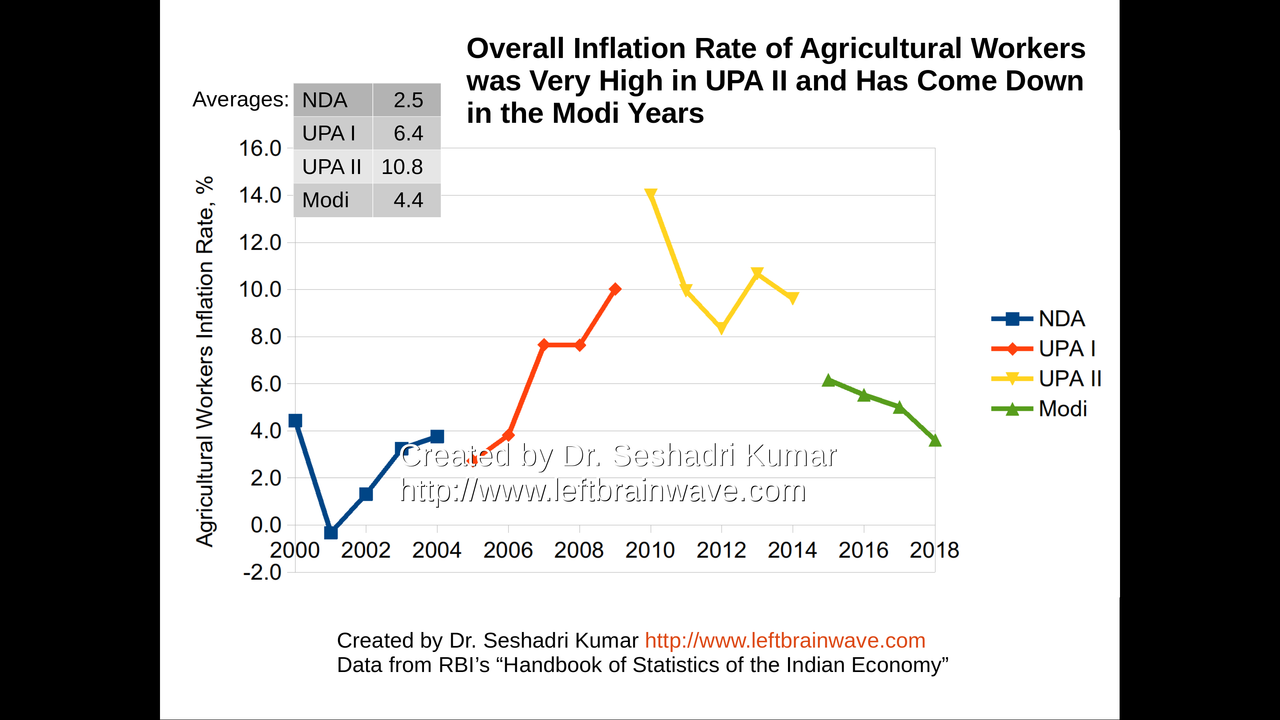
Inflation Rate for Agricultural Workers
111 / 120
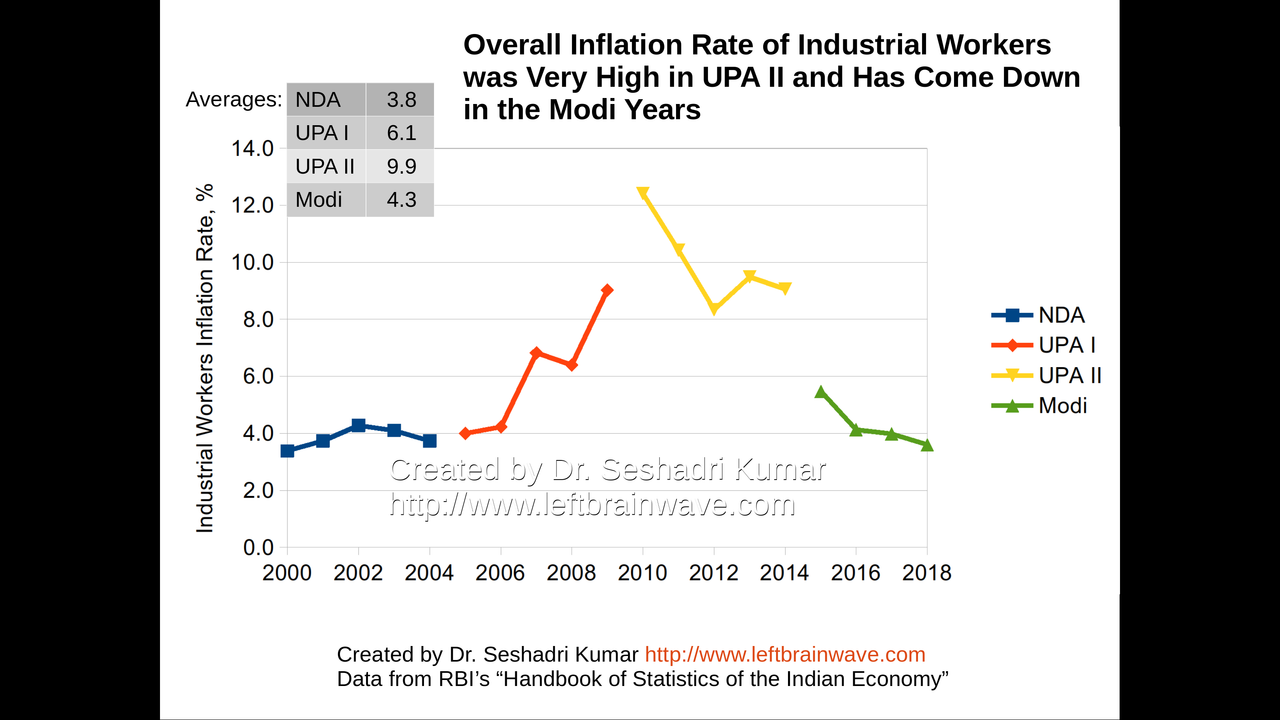
Inflation Rate for Industrial Workers
112 / 120
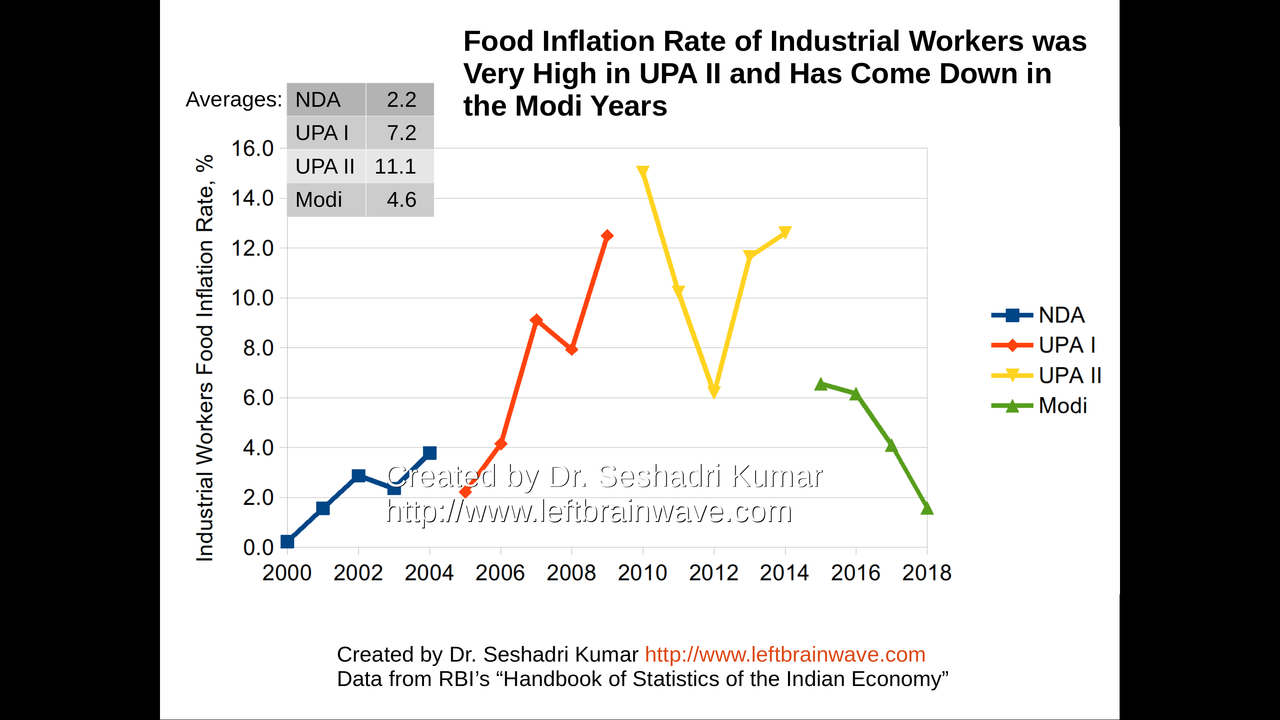
Food Inflation Rate for Industrial Workers
113 / 120
Inflation and Unemployment (2/3)
114 / 120
Inflation and Unemployment (3/3)
115 / 120
Overall Summary and Conclusions (1/3)
116 / 120
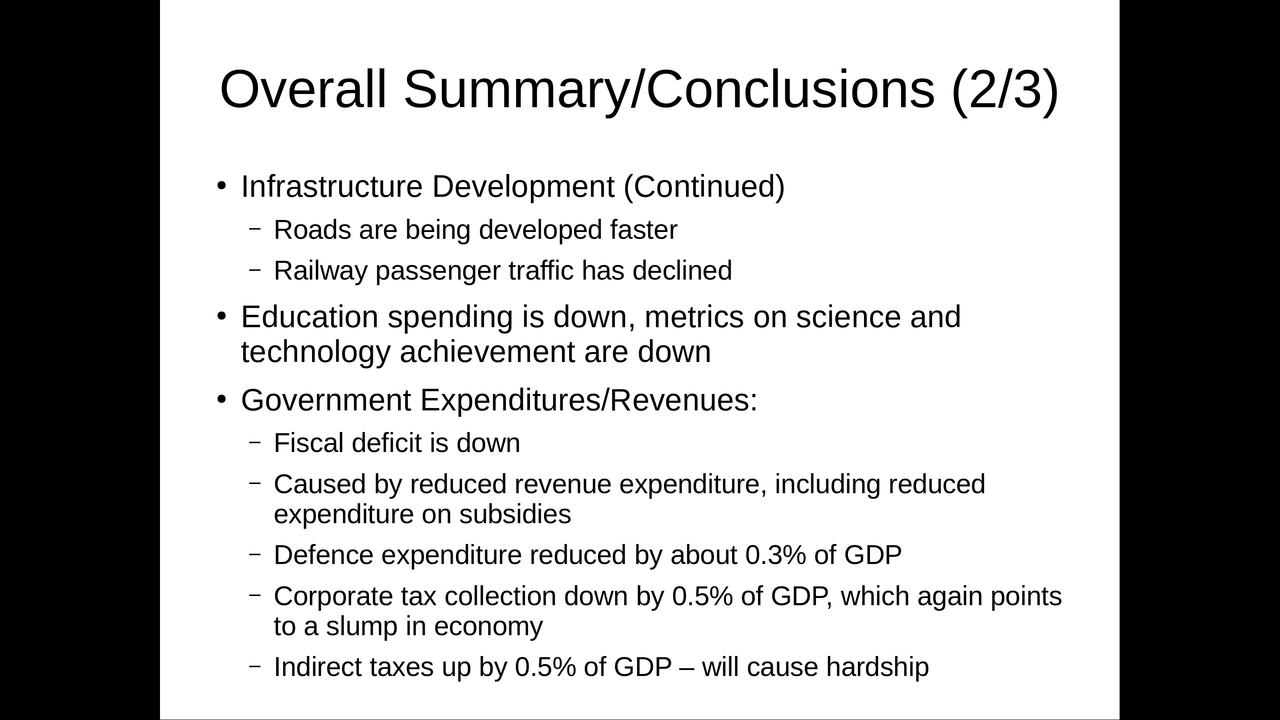
Overall Summary and Conclusions (2/3)
117 / 120
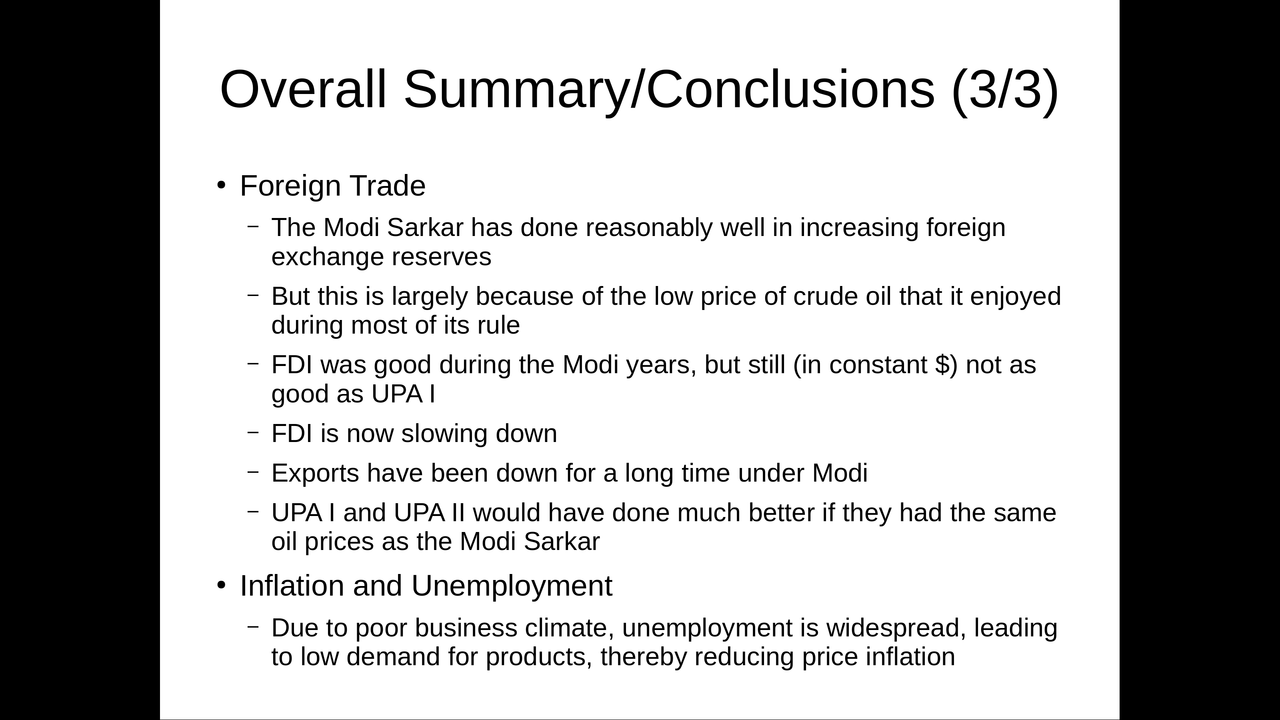
Overall Summary and Conclusions (3/3)
118 / 120
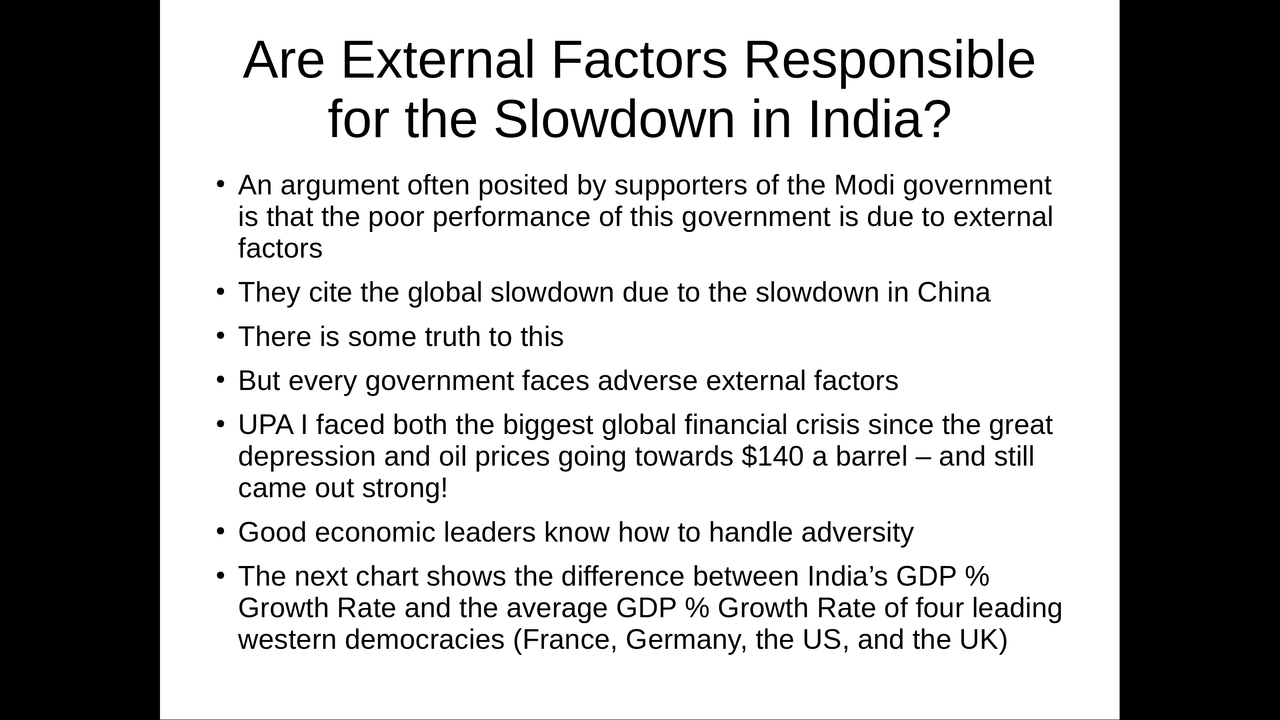
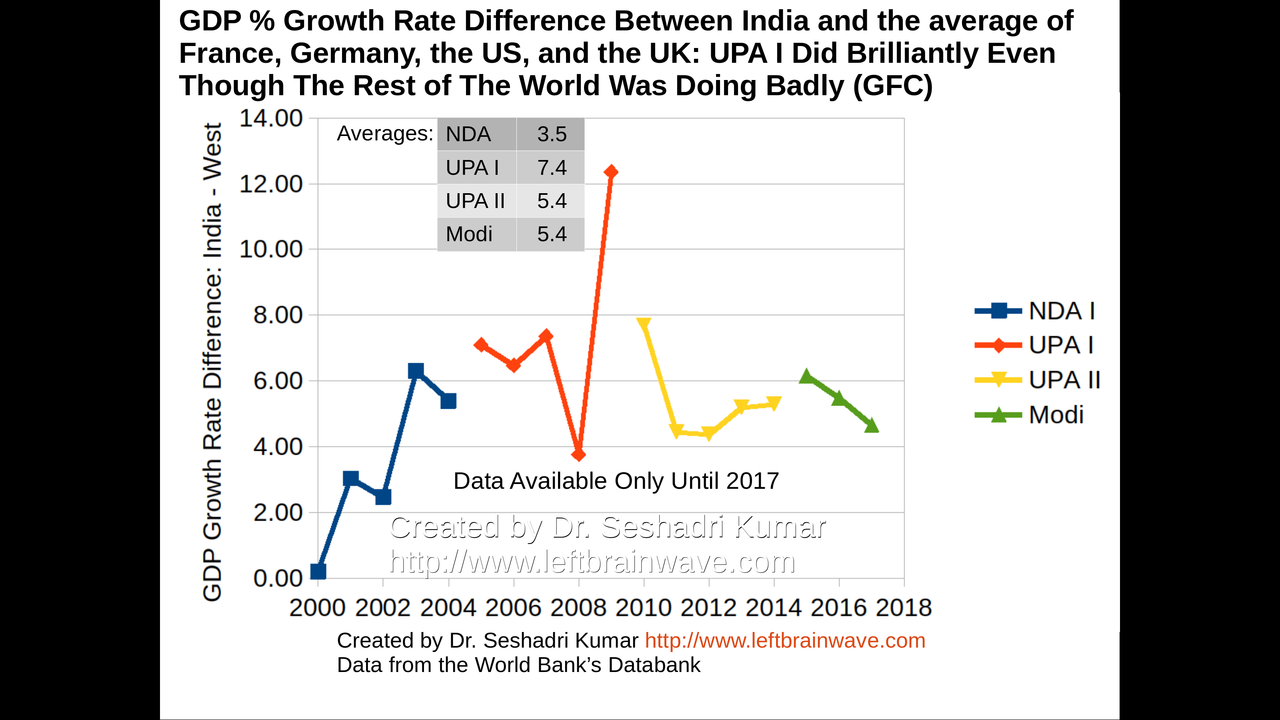
External Factors
119 / 120
Performance of UPA-I Government during Global Financial Crisis of 2008
120 / 120
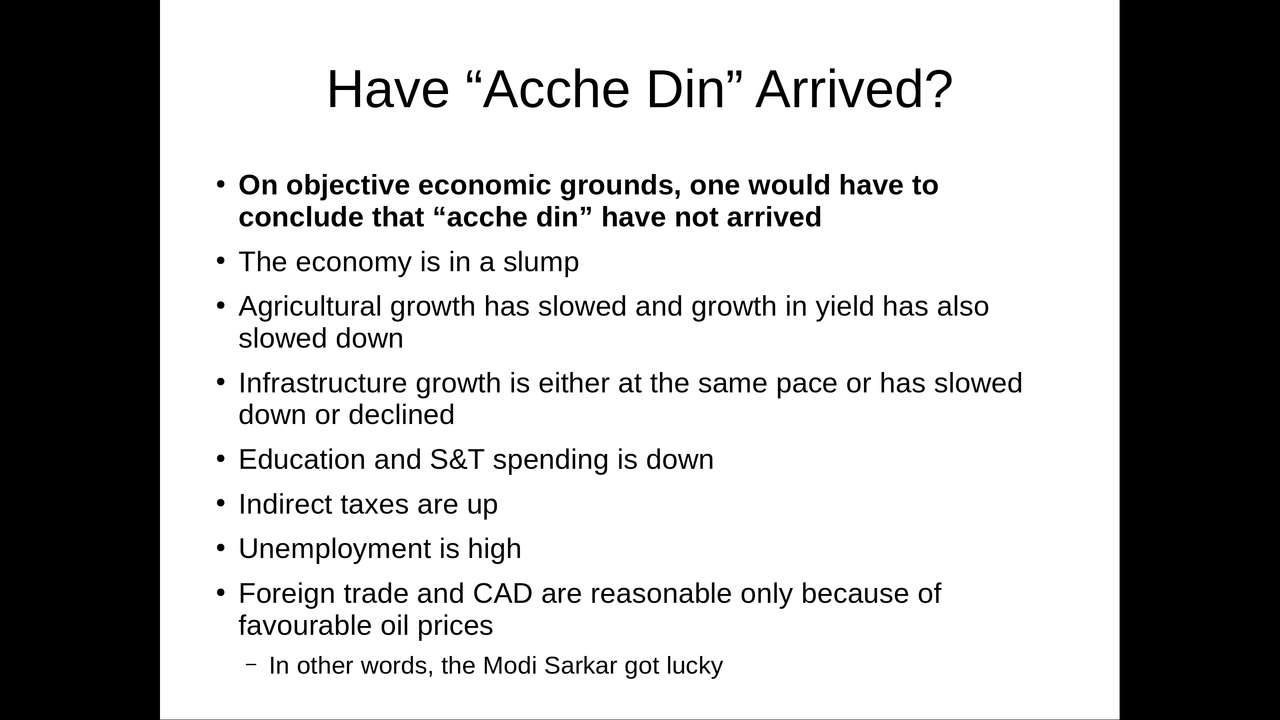
Have Acche Din Arrived?